
2 September 2026
This transcript was generated automatically and may contain errors.
Hello, and welcome to the July 20, 24 ctec Live webinar. Welcome, wherever you are calling in from today. we're delighted to have you with us. my name's Thomas Armstrong, managing editor of International Cement Review host today for this webinar we're over halfway through our series. this webinar will be quality Control. Last month, it was pyro processing and we kindly had Jim O'Brien stepping in as the chair. next month we'll be looking at decarbonization followed by conveying and storage, then plant maintenance in November. we'll finish the year off with a special session on Green Cement. So if this is your first webinar, welcome welcome back to everyone who's familiar with our platform.
if not let me give you a brief introduction. Cemtech Events are organized by International Cement Review the leading industry magazine. we've been publishing for 35 years monthly Magazine covering all cement manufacturing technologies best practice. So looking at mar big in industry trends and obviously following the markets and developments in our sector. So wherever you are working in our industry it's great to have you here. and if you are here, have a look at International Cement Review. Visit cnet.com and take out a, a subscription. all subscribers will receive a copy of a handbook. this is the Cement Plant operations Handbook.
now in the seventh edition, really a stormwater, a real a reference that is indispensable if you are anywhere near cement factory, either operating or need to understand how cement plants are operated. this very, very helpful reference is available. It's free to all subscribers of International Cement Review. we also have the environmental Handbook. this was released about a year and a half ago, two years ago. it's really a compendium of 40 articles covering lots of relevant environmental papers. CO2 emissions process optimization, alternative fuels grinding Systems, clinker substitutions.
there's a chapter on cement Plants of the Future, everything you need to know for the industry's journey towards Net zero. Again, it's free to subscribers of International Cement Review. you may not know it, but we also publish comprehensive volume statistics for the cement sector. this is the Global Cement Report. It comes with a coverage of around 175 cement markets and a plant directory online plant platform with around 300, 3000 cement plants. if you need to understand the sector in more detail than the superficial information you might be reading, this is the this is the product for you.
a quick word before we get started on Cemtech Europe, coming up in at the end of September, start of October, will be this year in Poland, in Warsaw. we were there back in 2011, so it's great to be back. an amazing industry in Poland, one of the largest in Europe. some very exciting projects happening there. Plant modernizations, carbon capture, and sequestration. projects. We will have a fantastic lineup of speakers. We have an exhibition with around 30 world class equipment, suppliers of plant water, helm, cement, semi is plant, which is famous for very high alternative fuel utilization rates of around 96%.
So if you wanna see how how plants are managing to sustain very high alternative fuel rates this plant tool is is certainly one worth visiting. So that's coming up. Just log on to Cemtech.com/europe 2024 to register. And that brings me to today's webinar. cement Plant Quality Control absolutely at the heart of the cement manufacturing process. absolutely critical for maintaining product integrity for meeting industry standards. So we hope in this webinar we'll be learning from real industry leading experts latest products and technologies and techniques for managing plants, quality control.
and we'll be listening to representatives from four very well known com companies, really leaders in the field. we have scan tech Australia. We have SCT we have e Schmidt from Denmark, and to start us off today with his presentation process control in cement manufacturing using X-Ray Diffraction. I'm very pleased to be able to welcome Simon Wells Miller from Thermo Fisher scientific in Switzerland. Simon if I can give him a, a brief introduction Simon has been an x-Ray diffraction specialist at Thermo Fisher since 2017. He has more than 10 years experience in various XRD applications and techniques.
Simon holds a PhD in solid state chemistry from Leipsic University and a master's degree in chemistry from LMU Munich. So really, you can't hope for a more a more talented and expert presenter. Then Simon who's gonna start us off today. over to you, Simon. We can see your slides take it away. Thank you. Thanks for the introduction, Thomas, and welcome everyone. So, yeah, first I want to give a brief introduction into C Fisher. So, C Fisher has 120 more than 120,000 employees worldwide supporting our customers. We also have a huge investment into r and d with more than 7,000 people, and we also invest a lot into r and d.
And all of this allows us to fulfill our mission, which is to enable our customers to make the world healthier, cleaner, and safer. And to do that, we have quite a big portfolio of different analytical instruments. So starting from the left, we have cross batch elemental analyzers. Maybe some of you are familiar with those. We have different flavors and they are mostly used for raw material analysis or elemental analysis. we also have OES analysis, which are mostly used in metals industry. Here in the middle we have different type of XOF spectrometers. So those are lab-based instruments for elemental analysis.
So especially maybe the a l 19 900 is well known, which is really designed for, for the cement industry. And on the right we have two different kind of X-ray drac meters. the one I am going to focus on today is the AL extra companion which is a benchtop instrument, which is designed for routine analysis to give you a little some more details about this instrument. So it's a bench top sized instrument with a back burn tunnel or CTA seat ter. we have 160 millimeter radis, so quite big radis, also quite big measurement range, but it's really not important for this type of application. It comes with a 600 wat X-ray generator.
We use state of the art solid state 2D detector time pick three with a 55 micrometer pitch. And this detector also supports electronic photon energy filtering to suppress fluorescence. The instrument has manual slits and a motorized be knife. And in terms of performance specifications it, we can reach FWHM of maybe around 0.034. And we have a, a accuracy of plus minus 0.01, which is quite good for such an instrument. This one is available with an integrated chiller. So it's really one piece. You don't need any external dependencies. And we have a six position sample changer. just to give you a little reminder of the of the geometry of the setup of the instrument.
So we always have the sample in the center and the x-ray tube, so that's the source and the detector moving around the sample. This has the big advantage that the sample always stays horizontal. And also an advantage of the setup is that you can measure quite a big sample volume, but still have a very good resolution because of the power focusing of this setup. A little bit more details about detector. So as I already said, it's a time pick three, 2D solid, let's say detector. the detector has very good dynamic range which is here given the pixels. 55 micrometer pitch is also very good for, for resolution. we have 256 time, 2 56 pixels, so it's really very sophisticated.
and as I told you, we have electronic photon energy filtering, which also supports high and low energy threshold. So we, you cannot only suppress fluorescence, but also remove vital radiation. Here. A little example how this elec electronic photon energy filtering influences your, your data. So by, by putting energy threshold, you can dramatically reduce the background and in increase the signal to noise ratio. So this is an iron or center sample with roughly 50% iron content. In terms of accessories we have a six possession auto sampler with a sample carousel. we support 51.5 millimeter samples.
We also support 40 millimeter samples, but the sample cups are only available in 51.5 millimeters. So we have a huge variety of different sample cups for powders. Standard top loading, back loading, we have a special cup for, for clay samples. So there is there is some variety. And of course, we can also measure press samples and steel wings. In terms of analytical software we use a Wheatfield software called prox. The software is under GPL license, so it's completely free of charge. the wheat felt algorithm is based on the, on a fundamental parameter approach for profile fitting.
we can also do amorphous content using either in an internal standard or we can also use a calibrated tick list, which is maybe some familiar under the name of punks. And big advantage is that you can create templates or methods, how you want call it in this software and apply them on other, on, on other data and just receive the results. And we made an we made a connection between this software and our instrument control software. So you, we support one click analysis, so you can create your, your method and just call it from the analytical control from the instrument control software. Mm. So just to give you an overview of the benefits and the limitations of, of x-ray diffraction.
So in general with x-ray diffraction, you evaluate injection of x-ray with an atomic structure to determine the 3D arrangement of its atoms. And the information you can ascertain from this analysis are a couple of examples. So, for example, a chemical species in hammerite, which is I three plus versus ide, which is I two plus the crystallographic structure, for example. in, for titanium dioxide, there are at least two different polymorphs with avatar. you can do phase identification and quantification of crystalline phases. You can determine the am amorphous content, and you can of course determine the atomic structure of a material. And the method also has some limitations.
usually they are related to physics. so you get limited information on the elemental composition. So that's usually information you have to put into the refinement. The method is easy to apply, but quite difficult to master. the limit of detection is usually in the range of 1%. So strongly depends on the material, on the sample, but that's a ballpark number and it does not work for gases and liquids. So why would you use a lab-based XD analyzer? So one big advantage is that you can increase your efficiency by reducing your turnaround time in your daily, daily routine analysis work. there were some use cases.
So for example, for quality control or for materials and products, it's widely used in process control by analyzing intermediates, and of course, also in research and development for new material development. the benefits are lab based p the analyzer gives you, so the sample prep for operators is usually quite simple. You literally have minutes from sample prep to results. So typical analysis time is between five and 10 minutes. It works for solids powders and slow. it's a bench top sized instrument with no special dependencies. And yeah, we can offer easy instrument operation by one click analysis. So now I'm going to directly jump into some applications.
I think that's maybe most interesting for most of the people. So here is an overview of the cement manufacturing workflow. So we are going to start at the beginning with the raw materials. So there are always some challenges. so there are problematic compounds in raw materials. For example, clay in silica, which can cause problems with clogging or affect the cement strengths. And also, clay analysis is quite difficult by XID. So you really need a virtual software with quite high stability.
The solution we can offer is directly identifying quantify phases in any raw material and the analytical we can use analytical methods in our instrument control software, which is called, so six for higher stability in our one click analysis. So here are a couple of examples of raw materials. So so you can measure powders in in cups or pressed pellets for, for, especially for limestone, it's important to control the carbonate and the calcite ate dolomite content. you can avoid clogging by tracking clay and silica contents, and also the particle size is important for activity. And XID will give you an indication of the of the particle size. Yeah, so on the top we have two different samples.
So that's the yellow ones of two different limestones. On the left, there is one which is mostly site with a little bit of quartz and two other phases. here we have a quite a low crystal lid size which is nice for the activity. on the right we have another type of limestone, which is a mixture of coal site and dolomite, and also has a lot more clay here on the bottom. we have a sample of lan, so that's an additive for cement which is usually quite complicated. So I just put the main phases here. There are a lot of other phases, and the sample is also a little amorphous, so it's also possible to quantify this. And last but not least, on the right we have a sample of silica.
So it's mostly quartz, which has quite a low crystal it size 50, about 50 nanometer, so that's quite important for the reactivity. So we're directly moving on to the next step, which is at the kiln. And here we have hot meal and bypass dust. And I'm just quickly going to introduce what it is and why it is important. so there were some preconditions for the, the kiln needs dry and ready to react materials. the, so you usually do some preheating, which removes moisture in most of the CO2 then, which is then called hot meal. And the GU flow in the kiln brings back the volatiles into the tower. And this is called bypass dust. So sample, the, the hot meal is sampled after preheating.
the degree of ation in the hot meal validates the proper preheating and the bypass dust to concentrate the volatile elements, and it's a problematic waste. so bypass dust is monitored for CLO and sulfide ali content. So this is mostly XOF, so not much XAD here. And both sample types are highly reactive with air and moisture. So there were some challenges coming from that. So you really need a fresh sample for proper analysis. you have complex and varying sample compositions and the solutions we can offer that our analysis only takes minutes. So you, you, it's, it's easier to measure, to get really meaningful results.
And the analytical methods we can create com the support complex samples and can, can adapt to varying compositions. Here is a example just a quite random example of a hot meal. So there were a couple of faces we can track. So we have C two s here quite high in the sample. There was also some gamma C two s, which is because of of the cooling of the sample. these are some potassium sulfates. We still have some IDE and olamide left, and here was some some other some chloride seal. So yeah, and maybe there is also some, yeah, there is some Portland diet here as well. So this sample is not fresh. It was shipped to our lab. So therefore it's important to, to really measure fresh sample.
Okay, so after the kiln the next step in the process is then clinker. So the, the clinker is the product after ation and cooling. and this is the cementitious material in ordinary cement and also related cements. It consists of various ate, illuminates and other phases. There is usually a little bit of lime and some quarts. And then there were also different type of cements. So there was a standard ordinary pot type cement, which is about 95% clinker and some 5% of gypsum. you can, you can use additives. So for example, polan, that's a natural cementitious material from volcanic origin.
And there were also some more additives which are frequently used which is fly ash and granulated, last furnace slack. Those are waste products from other indu industrial processes. And they have good properties and are cheap, so you can, you can mix them in your cement. So challenges in clinical and cement analysis. So you have a lot of peak overlap from similar crystal structures. There were amorphous spaces in Slack, and we made rela related cements. And also in decarbonized cements, for example, with Stein clays you also add a lot of amorphous spaces. The sample preparation is crucial for reliable results. And we also, you need high repeatability, repeatability and accuracy.
So our solution is we have a one click XAD analysis with a method based software for convenient analysis. And yeah, quite easy, simple prep. So you can use the same samples you use for XOF also in xd usually here is measurement of clinical. So this is 10 minutes on a nist reference material. I perform 21 ones on this sample to calculate the repeatability. In the table. On the right, you'll see the results of this refin of our refinement. in this refinement, we can so it's a 10 minute scan, scan in this refinement, we can also refine a C3 s, M1, M three. There's standard deviations giving in this table as three sigma. So keep this in mind.
So usually a lot of people give one sigma, so if you divide the, the number by three, that's maybe what you're familiar with. And yeah, so we can easily comply with with the a SDM three one C 1, 3, 6 5 norm. So that's really no problem. And overall, quite nice results. if we then move on to cement here is analysis of, of em one. So that's, in this case it's a five minute scan. I did 11 ones here also to calculate repeatability. So here you can see we can also do M1, M three in, in a cement, even in five minutes with quite good repeatability. we can also do all of the calcium sulfate chips and mite and hot, right? The value we get here is within the range you would expect.
So that's a standard sample of, of SEM one. And then last but not least I wanted to talk a little bit about amorphous cement materials. office materials have no quest monographic structure. So it's the quantification refill refinement is quite difficult. There are different approaches how to do this. So there are, I would say, two different methods, maybe one users in the internal standard with a known number of his content. It's quite precise, but you have quite complex sample preparation, or you can use a calibrated peak list. So for this, you, you you have to have a reference sample to calibrate your peak, and then after this, you can reuse the you calibrated peak for, for other samples.
So this what we call calibrated peak list is also known as punks. So that's quite similar. Here is an example of this. So it's an artificial mixture of a clinker and a slack. So to refine my, my peak or to, to calibrate my peak, I used the 50 50 mixture with slack and clinker. So that's a bot here in the center. And then I made other mixtures with 20, 30, 70, and 80% of slack content. And here you can see the linearity of the, after the refinement, and you see, okay, this is really close to one. So this this quantification works extremely well. So this is really the go-to method for the quantification of, of amorous content. And this already concludes my talk, so thank you for your attention.
And if you have questions, feel free to ask them. I see there were some in the QA box. I will have a look. Yes, thank you very much Simon for, for that presentation. Really concise, but gives a really impressive overview of the different options with XRD across the manufacturing process. Very very broad. you highlighted the quicker turnaround, simple operation you know, analyzing solids and powders, slurries. So it's it's clearly a central piece of technology. we've got some questions. maybe if I just ask a few from the q and a Yeah, sure. to, to just answer some, some of the basics. one, one theme is what, what can you measure?
So can you talk a little bit about can you measure also coal the elemental analysis of coal it's related to fuels. What about RDF and MSW? have you any experience in that area as well? So these, I usually XOF question, so usually you want to have the elemental composition of fuel. Fuel, yeah. So usually there is not so much XAD in there, so at least at the moment. So I have no experience on, on fuel. So my colleagues in the, if in the XRF department, they do this a lot. But with XRD at the moment, we Saw that in your pro your product portfolio at the beginning, that was one of the, yeah, also part of Thermo Fisher. yeah. Okay. That's fine. That's clear.
how does the XRD assist in estimating particle size? so there is a relationship between the, the peak width, so I can maybe just go back mm-hmm. To slides. So yeah, here you can see, so each of the peaks has a width, and from this width, you can make an estimate about the size of the particle. There is a relationship, there's a formula, which is called shares equation. So it's quite ancient maybe from the, I think maybe from the fifties already, so very old already. And from this formula, we can just calculate a crystal it size. So, but the, it's a bit little bit misleading because what you calculate is actually the size of the scattering domain, so that's quite scientific term.
And the particle might, might be, might be bigger because crystal lids can lump together and form bigger particles. So therefore it's, it's only an indication and you need usually some more information about the sample, but it gives you an indication. how, how can we analyze how, how, how is the data analyzed by the XRD after the data is acquired? Do you need software to do this automatically? or manually? Okay, so so you, you want your sample and to do this in our software we offer the service to set up an, an, an analytical method for you. This method contains the measurement parameters and also the analysis parameters.
So this means you load your sample, your select your sample type, and you click start. And what you get at, at the end is the results. So you, you get a face list like here with your quantities, and those can be exported as a report or transferred to a lis, however you prefer, and then used as your base for your decision making. Either it's a process control or it's your, it's your final product check. depends, but usually the operator has, there is really no, it's completely automated, so the operator only has to start the, the mesh, the measurement, and then everything else is done automatically. Cool.
and, and just from all the different features that you've highlighted what, what, what is the most commonly used in the cement plant or the most in demand, do you say? You mean for Yeah. Which aspects of the manufacturing process do you find that your, your clients your customers are using? this equipment mostly for, So we are see, we see a huge shift from XOF to XAD. So mm-hmm. A lot of people are now really going into XAD, and also the detail of the analysis is increasing a lot. Mm-Hmm. So people really try to get information about a lot of phases. For example, this M1, M three phases here. This is not brand new, but quite new. Yeah.
And this will give you some information about the strengths of your, of your cement, because they have different set strengths of the setting. So this is some quality information of your, of your cement. And also there is a lot to learn about about the, the, the process about, for example, if you have a lot of C two s gamma, which I showed, this shows you that the cooling of your, of your clinker is not correct and you should improve or you should change how you cool your clinker.
So there is a lot of information to get from this analysis, and it's it's more information as you can get from, for example, elemental analysis because this is really related to crystallographic faces and not so much to, to elemental analysis. And we see it really throughout the whole process. So for, for all of the raw materials through, through the intermediates, also for the final products, and also with the introduction of more deca decarbonized cements, there were also new raw materials popping up, like I mentioned, carine clays and other stuff. So it's really, there is some, some traction in the, yeah.
And I, I imagine that the whole adoption of digitalization requirement for increased information and data and monitoring of, of the process, it, it, it just becomes more and more more and more demand for that. Yes, sure. I mean by closely monitoring your process parameters, you can just increase the efficiency of your process. So you reduce the fuel fuel you need to increase the, the quality of your product. So while you just save cost. Yeah. And yeah, that's usually when people are really into it. Yeah. Very good. Well, thank you very much Simon excellent presentation. really appreciate that. Thank you.
any any further questions please look in the q and a and I'm sure Simon will will address, address some of them now. I'm going through them now and typing some answers. Yeah. Yeah. Fantastic. Okay. So thanks to to Simon from Thermo Fisher Scientific and Antoinette speaker Jenz Peterson from FL Schmidt in Denmark who's gonna speak on the structured acquisition of sample data across automatic and manually operated laboratory equipment. so while Ys puts his presentation up he, he's ha has vast experience 27 years at FL Schmidt and much of that in laboratory automation, starting in project engineering and commissioning, he gradually moved into global standardization and product management.
He's driven the development of the company's standards for automated laboratories, including equipment design, system engineering, controller programming, and robot programming. Jens leverages his background in his current role as a global product manager for sampling preparation and analysis, focusing on standardized yet flexible solutions to deliver reliable and competitive systems to customers. so Jens we can see your slides over to you. Thank you very much, Thomas, for the introduction and let's move right ahead. The title of our presentation today is structured acquisition of sample data across automatic And manually Operated Laboratory Equipment.
And the plan is that the I during the next 20 minutes will present our take on the importance of well-structured sample data, and also explain how we expect such data to gain even further importance in the, in the future. But let me start out with a single slide about our company Hel Smith Cement. Those of you who have followed us will notice that the numbers on this slide are somewhat different from what you may have seen in the past. The reason for that is that Hel Smith this year has been separated into separate entities for cement and mining, and that means that the numbers you now see on our air mid cement at a landslide are covering the cement part of our company only.
And therefore the numbers are quite different from what, what you have may have seen in the past. But that also means that the, everything you see on the, on this slide, all the resources available on this, on this slide are actually what we have to serve our customers specifically in the cement industry. Then moving forward with a quick slide about the bottom line, which I'm looking after QCX is our registered trademark for quality control expert systems. And we are with QCX covering the full value chain from sample taking in a cement plant to finished analysis results and quality optimization. And we are delivering both equipment and software to cover this.
If we try to look at it at it graphically, it will be like this. We will start out with the equipment and software for fully automated sampling and fully automated sample transport. This is covered by our software module QGX auto sampling. Then moving ahead to the lab, we will have equipment and software for fully automated sample preparation and automated analysis. You may know our QCX robot app software module, which is covering that. And then last, but certainly not least, we have our optimization software the software intended for optimizing the chemical quality of of our, of the products. And as a cement plant, this is qg plant expert.
And that software will normally take the results from the automated analyzers in the lab and combine with results from online analyzers in order to which optimization. And now let's move on with some of the topics which are on the agenda today. First, let's move a little bit further into the world of automated laboratories and let's look at how things have been done. Additionally, in the picture, you will see a typical small laboratory automation system with some sample prep and, and analyzer. And here in the lower part you will see the laboratory control system, which also contains a sample database, and you will see some analyzers.
And the traditional approach has been that analysis results from the manual, sorry, the analysis results from the fully automated analysis equipment, they would go always to the laboratory automation system. This makes good sense because the laboratory automation system needs to talk to this equipment in order to make sure we fit the sample in automatically and ensure that the, the analysis is started with the right analysis program and so on. On top of that, the approach has been that results from manually operated laboratory equipment. This is equipment where samples are somehow fit to the equipment manually.
Such results have sometimes also been passed on to the lab automation system, but this has been more rarely. It has typically been the case. For example, if the results are important for other parts of the automated system, the best example is probably a manually operated XIF analyzer. Here, the results are super necessary for the rix control software, and therefore, of course, it makes good sense that the results are fit into the automated system.
Now, let's instead look at what is happening now in these days when we talk to our customers, we see an increased desire to acquire and store analysis results, not only from the automated analyzers, but also from the manual intended analyzers in the lab. And it seems that there are two different reasons for that. One of the reasons is that we see increased demands to efficiency in the labs, and also that we see increased demands for documentation. And that means that it is not just enough to have handwritten results from some analyzers or have some printed results from some analyzers or some Excel sheets with the, with the results.
There's a strong desire to get everything into the same environment, into the same database and manage the data there. The second reason, which is also becoming super important these days, is that we in the same industry see a strong drive drive and a strong curiosity towards applications which can use different kinds of artificial intelligence. And this is one of the things for I will back to in a later slide, but let's leave it for that now. Anyway, these two things naturally trigger some new wishes and some new requirements to the laboratory system architecture. Now let's move on and take a closer look at laboratory information management systems.
These are typically the, the systems which are keeping track of all laboratory operation, managing recipes, and most importantly, storing analysis results. So they are available when needed. Such systems come in many different flavors, and also with features which are targeted specific industry segments. Some examples could be pharmaceutical laboratories. Here there will of course, be a very strong focus on features which can help documenting co complying compliance with the legislation. And another example would be commercial laboratories.
Those are laboratories which are analyzing samples as a service for various customers in such laboratories, there will obviously be a need to manage customers and also ensure that the, the correct invoicing is happening when samples are analyzed. But when we look at cement implants, one of the common laboratory is a production laboratory, and we will, in the following, use the wording production limbs to describe a limbs system, which is specifically target production laboratories. You see an example of a production laboratory here at the right side. This is a typical QGX roboto lab where we had a robot, which is serving various sample rep machines and various analyzers.
Production laboratory are typically characterized by having routine samples. That means many repetitions of samples, which are prepared in the same way using the same recipe. Also, they're characterized by having a very high degree of automation and a high throughput per hour or per day. And truda for such laboratory a production limbs would typically lead strong features for taking care of recipe management. It would need a very well structured sample database. I will come back to that.
And then of course, since we are looking at automated laboratories, there will be need to be equipment interfaces for data acquisition for selection of the right analytical programs for automated sample handling and, and so on. And on top of that, obviously we need to present everything for a user. So there will need to be user interfaces with the features which are covering the daily needs in such a labor laboratory. Some examples would be assemble viewer, which can show all the samples which have been processed during the day in various formats. And of course, features for reporting and for trending.
That was a few words about our production limbs, but let's now try to look at such an system in a cement plant context. And what you see here in the picture or in the overview is is quite generic, but I have used our product names here in the boxes, but additionally listed in the circles around what the different modules are actually doing. And they start out with the production limbs in this dark blue box here with the Q six manager, we have a production limb system, which is take care of all the basic lab operation and collecting lab data. We see here a couple of fully automated analyzers either sent by a robot or having samples fit to them by a build fully automatically.
They are, they are connected to the production limps. And we also here see a manually operated analyzer, actually the operator here. And that is also connected to, to the production limps. In the top, we have some add-on packages. We have QX auto sampling for fully automated sampling and transport. And we have QX robot app for automated sample prep and analysis. These are automation packages, which need to work closely together with the production limbs. And then we also have our chemical quality optimization QC plant expert, which in the traditional setup is taking care of the rmic control in a cement cement plant.
And it goes without saying that such and optimization package rely heavily on the sample data it'll get from the production limbs system. Then in smaller plants, a production limbs like the one we see here might be sufficient to cover the daily needs for a limbs system, but it could also be that more than this is desired. And we see in many cases that a plant, in addition to the production limbs, has some kind of an overall limbs or plant data management system. An overall limbs would only be looking at laboratory data, but it would offer additional limb features on top of what you can get from a production limb system.
But it could also be a plant data management system, which is combining the atory data with process data coming here from the process side of of the plant and making everything available for users and for automation packages. An example of such a system is our ECS plant data management system, and most importantly, these all systems, they can be other specific to one single plant or they can be implemented at group level and cover several plants. I hope this little drawing demonstrates that there are many players involved in the handling of of sample data and other data in the cement plant.
And also I hope it underlines the importance of planning the sample data infrastructure carefully and making a series of informed choices when doing so. And now moving on to something which is often forgotten or perhaps even we misunderstood when planning how to capture and install process data and sample data. And that is discussion, the discussion about process data versus sample data. Because these two data are fundamentally different and it is necessary that we come up with some solutions which can cater for both. Let's first look at process data. These are typically time series data, and that means they are sampled over time, typically at equal time intervals.
One might think of them as sensor signals and then as an example of that shown here below the drawing or below the text where you will see some of those sensor signals changing over time. Then at the other side of the picture, we have the sample data, and these are by nature more complex. First of all, they're not necessarily sampled at equal time intervals. Sample data or samples are usually taken when it is relevant, and that could be one hour between, that could be two hours between that could be more. It could also be that they assemble when the production reads a certain number and so on. Also important is that sample data have very important metadata.
Metadata are basically data about data. A good and well known example is is a time assemble was taken. The timestamp from the sampler at the very point in time when the sampler was taken is super important for the sample. We have a sample here called 163. And the timestamp when this sample was taken is very important because a lot of the the high level software might not be interested in knowing when the analysis result was ready, but it would need to know exactly when was the sample extract from the process. Another example, perhaps this obvious would be some of the sample data coming from, sorry, some of the meta data coming from the analyzers.
For example, when combining data from choice across several plants, it could be very relevant to know for a specific type of analysis on which analyzer make model was this analysis made and perhaps also when was this analyzer last calibrated? Those are also examples of metadata, which is could make sense to to pass on in the system. I also hope that that this little drawing here on the right side indicates clearly that that the sample data can be pretty complex in terms of structure.
We can see here that this is not just a flat structure, this is actually a tree structure because a sample can be divided into several preparations or subsamples, if you wish, which are then analyzed individually on various analyzer types. Also important is that for sample data, it can potentially be a pretty long time from a sample is taken until the analyze analysis result is ready. Something in a range, 15 to 20 minutes is not unusual for a raw mill sample from the raw mill. And also important is of course, that the, that a sample will typically cover a a production time span. and this also means that it will cover an underlying tenet.
Then let's move a little bit further and try to take a little look into the future and do some gazing about the future importance of sample data. Artificial intelligence AI is definitely one of the important technologies under the industry force zero umbrella, which everybody are talking about these days, and there's no doubt that AI has a lot of industry relevant use cases for those working in cement ranging all the way from soft sensors to advanced decision making and optimization.
Ai and especially one of these disciplines, which is machine learning depends heavily on the availability of large amounts of reliable and well structured data simply because in machine learning learning, you need the software to be trained and to be trained, probably we need a lot of data to be available and when we need a lot of data, this obviously also includes the, the sample data we have just been been discussing. So the question here is how do we best acquire the sample data from as many and analyzers as possible, ensuring that they, they are available for the technologies we have, we have today, and also for the technologies we are planning to implement in the future.
Now, let me move on with a slide, and this looked like a very complex slide, but I will try to go through it quickly. But when we are talking about analyzer automation, it is super important that we set our ambitions right and we have tried to structure a bit here from, from our side in enable smith cement. And if we look at the, at the possible levels of ambition, it can range all the way from a very high degree of automation to a a low degree of automation. With the high degree we have super efficient operation and low risk of of human error. But of course it comes at price of of a high initial investment.
Moving to the other end of the scale, to the low degree of automat of automation, we will have something which is labor demanding where the risk of human error is is higher, but where the initial investment is is low, It should not come as a surprise as that the, when we are having fully automated sample handling analysis, we are in the very high end of the scale. This is something we have been doing for decades, and this is what is happening in all our automated laboratories.
I also mentioned that sometimes we have cases where we have analyzers, which are being, where the samples samples are being fit manually, but where the rest of the analysis process is happening automatically, the operator will start the analysis from a UI on the production limb system, and from there we will have transfer results transfer automatically. This is also something which is pretty high in the hierarchy of automation and where the risk of human error is pretty low.
What we can see now is there's an complete desire among our customers to go one step further down in the hierarchy, and that is to make sure that results from instruments which are perhaps less advanced also are fit into the production limb system. And this will, of course, require a bit more manual intervention, but still there's a very strong focus on ensuring that such results can be captured automatically. So we will not have the risks of making human error, for example, when typing in the results.
And this is exactly where we have decided to put some of our development focus in 2024, because we can see that by improving some of our functions which can support this, we can actually make it feasible for our customers to integrate a lot of additional instruments in the fleet and in the manual laboratory. And then finally, we have our offline instruments, which are basically instruments which are not connected at all and where the customer or the user simply will need to type in the results. That was a pretty long presentation, but let me end up mentioning that.
we have tried to and, and of course we can only take the, the overall things here, but we have tried to collect everything based on a lot of discussions with our customers and our internal investigations into a white paper, which is named what to consider when selecting a production limbs. And that white paper is being prepared just now, and it'll be available for download from our cement website on July 12th, 2024. So I really hope this little teaser has kind of created some appetite and that you will go to our website by the end of next week. And if you are interested, download this white paper.
Then finally, to wrap up, the production LIS plays an important role as frontend for acquisition and storage of simulator at cement plant. We expect industry four zero will set 30 months to this as an example, due to the need for detail and will structure assemble data as basis for ai. So careful planning of assemble data and infrastructure is becoming increasingly important. And with that, I would like to say thank you very much for attending and see if there are any questions. Thank you very much, Jens. That was a, a great presentation. the the robo lab is great, great to see the, the pictures of that, and that's at the higher end of automation, and you showed the whole spectrum.
users can come in any, at any level as you pointed out, and a lot of discussion around data and the, the, the quality of data and actually preserving it in a way that can be used in future. I guess that's more and more important, as you said, from potential for future technologies, AI to to start using this data. And it's something that you wanna preserve in a, in a very kind of standardized, coherent format which I guess is is something that you help set up or is standardized within your, your systems. so just one, one question here. it says yen, this is from John Klein Ys.
It seems that you've done a good job on the production of limbs, but what about the physical side of the plant lab and the user and concrete lab data into integration? It does seem to be a trend of yeah, now extending into, into concrete production the use of data software, AI applications sort of bridging that, that space, I guess between the, the, the cement plant and, and concrete production. do you have anything to, to say on that front? I'm a little bit uncertain about the question, but I I could read it in the way that we might be talking about the, the physical testing lab in a cement plant. Mm-Hmm. Okay.
And if I'm right about that yes, that is certainly something which is on our agenda and something which we are also investigating further this year because we can see that the, that customers are now requesting us to go that step further and be able to integrate data from the physical testing into our sample database as well, which is making a lot of sense. It will be very super difficult to automate such labs fully, but having a production lab which can also acquire data from the physical testing is making a lot of sense. Mm-Hmm. So something we'll, we'll see more and more of in the future. definitely, yeah. Okay. Good. and just in terms of, there's a question here about the maintenance.
you know, in, in these highly automated labs is, you know, how, well, I guess what's the, what's the uptime? is it something that requires a a heavy maintenance? I mean, one of the reasons for the, for this kind of robotic automation is to improve consistency, but also consistency matters as a manpower issue. So what, what can you say around that topic? Yes, I, I fully agree. the, the, the more automation we introduce in our sample preparation and analysis the more complexity we add, and that will of course come at a cost of of maintenance. So it is always a matter of weighing the added complexity against the benefits it can give.
I think we have over many years proved that for the routine samples we we send through a accusation robot app it makes very much sense to to go for full automat automation. And it also is fair to to take this higher maintenance cost in order to keep the production lab running. But there are other pockets of, of lab automation where it is probably more difficult to make a business case. And and this is also why we are having this focus now on on capturing results from analyzers which are not automated to the same degree.
Because even if it is not feasible to go for full automating for an analyzer, it can very well be that it makes a lot of sense to ensure that we capture the results automatically and thus reduce the probability of of human error as much as we can. Mm-Hmm, Sure. Very good. Well, thank you for that great presentation. as yes, yen said, there's a, there's a white paper if you wanna follow up on that, and we will be distributing the slides. so all that information will be made available to you after the webinar. Thank you very much, Ys. Likewise. And let me mention that my contact details are on the last slide here. So in case you cannot locate the the white paper just reached out to me.
Very good, thank you. Okay, so we're gonna move on into the second half of this webinar. and taking up the the microphone now is Roger Mayer from F-C-T-A-C Tech Australia who's gonna talk about the unlocking the new opportunities with X-er analyzers. a little bit about Roger. he, he's spoken here before, so may maybe you, you remember him from his last presentation. he's been general manager of the of global business development and FCT AC Tech since July, 2020. He began his career as a product specialist in X-Ray diffraction at Phillips Analytical. Since then, Roger has gained more than 20 years of industry experience at industry leading companies like FL Schmidt.
Roger holds a diploma in mineralogy and a PhD in material science from the University of Ang and in Germany. Another, another expert for us to take us through this next presentation. Over to you, Roger. We can see your slides. so I think you're ready to go. Thank you very much, Thomas, for the kind introduction. of course, I, I would like to change it a little bit now in a way that I don't focus on the, on the, the high-end, let's say science of the things. I would like to show you the real opportunities by using these analytical equipments.
And this is also a, a pretty new approach these days to, to step from, let's say ALINE analysis from individual sample to continuous analysis in the world of XAD and XRF. We are well used to this already for the online analysis based on nutrients and other radiation sources or moisture. But these days, I think in particular, this opportunity is great for the cement industry and opens a lot of opportunity to improve the efficiency, to reduce the CO2 emissions and to get a very grip on the process. So in my talk, I would like to show you the general function of these online analysis. I will go with you through four types of applications in the cement process, and of course seeing is believing.
I also would like to show you a little bit to paces where the RO mill RY analysis for certain cement plants can be a real added value to improve. And I will conclude my talk with a summary. FCT is already more than 25 years in the field of building these online analyzers. The origin of the company was a corporation between C-S-I-R-O, Adelaide Bright and Cement, and FCT. And over the years, of course, we, we made all possible mistakes, but the good thing is we learned from these mistakes. And there we more or less in let's say 20 15, 20 16, my colleagues decided to make the ultimate online analyzer for r, d and X ref.
And three main targets were to have a simple analyzer to have as less as possible maintenance, to have it affordable, that the whole system is easy to be installed, and that it's very close to the sampling point. And we ended up with such a nice box like you see here on the right hand side. for your information about the dimensions, it's about 75 by 50 by 60 centimeters and it's usually lo located not more than 10 meters from the sampling point. Also, based on this new technology and in particular the sample handling in the analyzer for fine powders with a particle size below 200 micron, we do not need any sample treatment or preparation.
We can measure the power directly, which gives you a extremely low time interval between sampling and the analytical results, which is a super recondition for you to do a successful process optimization and quality control. In case of causal materials, there can be a inbuilt grinder or external grinder be used in the process also to process materials like Lincoln. the system itself is self-containing, so it requires only a 1000 watt power connection. And we can report the results every 1, 2, 10, 20 minutes, depending on your needs.
And on the specific applications inside the system the only thing which is moving is the sample material and the supporting equipment to move the sample through the analyzer. All the analytical components, they are in fixed positions, so we use semiconductor based detectors and this increases the re reliability. Also, the systems they come fully calibrated to you that installation time is usually in the order of magnitude between two and three days, including a basic trainee. The whole equipment is or can be covered with thing we call igloo. It's a ization kit to protect it against mechanical attacks heat and, and moisture. And the system can be used.
Mainly the intention is to use it for online analysis, but of course, via the software, you can take it out of the automation and use it also as a backup for emergency for your lab equipment. Now, where do we see the analysis? We see four crucial points in the cement manufacturing process, where the first point is the control of the RX color quality, and of course the influence wire appropriate software. For example, the software we have seen before from smis, the blend expert to interact and to optimize the different fetus. And to have a perfect raw meal, it's, I always compare it like preparing bread.
If you don't have the right ingredients, even after the home, you will not get a proper bread. And therefore this is one of the crucial steps in the production. At this point, we look only on the XRS part. If you go further down in the process, then you will see that the next step could be the pre heter. In the old days, the pre heter was not there. Later it was introduced. Nowadays it's a very, very crucial step in the process because you reduce the energy consumption of the whole process by using a preheat, but it also can give you trouble. In particular, if you use a lot of alternative fuels or similar materials, then it can cause a clocking in the preheated.
And if the, in the worst case, it can block the whole process, which we will require a shutdown of the plant and cleaning of the specific parts, and you will lose a lot of production and money. And also the startup usually is not that smooth, so you want to avoid it by using there OFX or CM X analyzer from us, which is a combination of A XAD and the XRF machine. We use there a detection system for XAD, which is based on the strip detectors. And we use XRF system with a silver tube and solid state detector, which is energy disser energy dispersive to measure also the element contents simultaneously. And there you get the whole information.
You see the free lime content, which is the degree of calcination, which is important for the process control. But you can also detect critical elements like sulfur and chlorine, which can cause this clocking. And if you see these elements going up, you can proactively react on the process to avoid this trouble. Then of course, after the kiln, when you have produced the clinker, you would like to check the clinker quality. And there again, the, or the OFX can do the chop. This are instruments which can detect the aide concentration, the freely content plus in the case of the OFX, it'll also cover the full elemental range from sodium to uranium. So you get a very good picture.
What is the quality of your semi-finished product at this point in the process and the results, they can be either used for optimization of the pyro process or streamlining the next process steps downwards to the cement, and then the final instrument is placed after the cement mill. There, you can either use a OX or a CMX, which are very similar machines only the CMX has higher XAD capabilities. So you can measure more phases, like also the, you can determine the slack content, you can measure the fly, the sulfates, the clinker properties, et cetera.
And this is for you the final step to be sure that the quality of the outgoing product is on target, but it can be also used to optimize the process steps before. So for example, if you switch between different qualities of cement by analyzing the material coming out of the mill, you can switch for between the different silos at the right point. To avoid that, you put two, let's say costly cement in the low quality silo and vice versa to avoid trouble and to optimize the production on the one hand side. On the other hand, you analyze the different compounds of your cement, which means this gives you the possibility to optimize the blending stem.
And by adding more limestone or more slack, automatically you reduce the clink effector. Reducing the clink effector will be very beneficial in the process because either you reduce the energy and the CO2 emission or you can use with the same resources, you can produce more cement. So there are different ways to utilize the results and I'm very, very happy if you have specific questions to have a one-to-one discussion with you or with you and your colleagues to see what we can do for you. Now in this talk, I would like to focus on the first application, the Roma analysis, which we do with our RMX analyzer.
As mentioned, it's XRF analyzer using a silver tube where we usually measure the normal eight elements like silicon, iron, aluminum, calcium, sulfur, magnesium, and so on. But of course, sodium, chlorine and other elements are possible on demand because we can cover the complete range of the elements which are accessible for the X-rays. The whole machine is fully automated, which means and this is the big difference of our approach with all lab approaches, the materials goes into the analyzer directly from the sampler via this tube, and there we have sensors to steer the process of the sampling, and we have always fresh material in the analyzer.
Then the material passes the analyzer, and after the measurement, it can leave the analyzer either being returned to the process or fraction of the sample can be also kept for further analysis in the lab or for other tests like the physical tests, et cetera. And this strategy gives you a very, very short time between sampling and the analysis. You get very frequent results, and it should be very easy to utilize the results. Usually what I do recommend is to use a software to do that, that you remove, as we heard also in the earlier talk, the human factor that the quality and the processes are harmonized and they are not depending on the mood and the person of the day.
So using this analyzer can be result in different benefits by having a more, let's say, constant and consistent input into the kiln. You have a standard deviation of the LSF, which is much lower, and this will result on the one hand in lower fuel costs, because if you have a very good track on the LSF, you can optimize also the use of alternative fuels. And this can lead to a significant cost reduction in the process. We all know if we run a more homogeneous constant process, we can reduce the energy req requirements.
But also when you produce your raw meal, many plants require a high quality limestone to correct the, the calcium content or other additives, which are usually much higher costs than the normal quarry material. By having a good rack on the, on the mixing of the material before it goes to the mill, you can also reduce the additive costs. And of course, if you have a very good homogeneous material going into the kiln, you will see that you have less wear and tear on the refractory in the kiln, so you can increase the other lifetime of the whole equipment. And you will see that this will also on a long, long-term remove the unplanned production steps.
I know many plants they have very, very let's say good homogenization silos, et cetera, but of course, they are also requiring a lot of energy, and it might be one option if you measure more precise and more frequent your raw milk quality that you can also save in these steps. At the end of the day, when the material comes out of the kiln, you will see by having incoming material with very, very low LSF standard deviation, you can bro produce the clinker on target, which means the clinker must be not over burned, and therefore you can also save their energy in the cement milling.
Also the frequent characterization of the, of the materials gives you this possibility to really go to the limits of using of alternative fuels. I only would like to bring into your mind that different fuels introduce a different amount of ashes into the process. So by knowing what is the fuel mix in the future of the day, you can more or less work more dynamically in the adaptations of the LSF. And at the end of the day all these steps together, they bring down the d downtime on the one hand, and on the other hand, they can also save a lot of lab equipment, which is usually more costly and more, let's say, maintenance intensive.
Now, if we go into real cases, and I picked from the many installations we already have one case of a cement plant in Europe. Characteristics is they run one dry kiln with a average production of 700,000 tons per year. They work with two piles with a amount of 18,000 tons. And when they switched from, let's say, a classical lab and a neutral analyzers to our analyzer, the target was to reduce the LSF standard deviations. And here we see two one month data sets of the LSF. The upper one is when they use the RMX and the lower one before they used the r.
of course, you don't see so many points that you would expect in this period because to really compare apples with apples, we decided to compare our results only in respect of the interval of the results they obtained in the lab where they do one measurement every three or four hours. Because all the other measurements are, they, they don't have the reference to the lab, and therefore we, we don't want to show them, we want to keep it simple, and we really, we would like to compare apples with apples because the lab results, they are usually the golden standard results.
And if we look on this one month period, then we clearly see that the LSF standard deviation went down from 4.6 to 2.9%, which is really a significant improvement of the process. And if you carefully look here on the data sets, then you see periods like in this area here where there is less deviations, and then there are these high swings in other areas. So I also extracted one week data sets, one in the smooth period where you see a reduction from 2.5 to 1.8%, and one with more let's say deviations in the LSF where the standard deviation went down from 7.1 to 4.5%.
So you see with this type of analyzers, it's good for optimizing the routine, the routine operation, but also for optimizing in more extreme cases. In this case i, I assume that maybe it comes from effects of the stockpile, et cetera, where you can also smooth for these situations, the composition of the material going into the kiln. And it's very, very clear by this significant reduction, which is down by almost 40%. In the extreme cases, you get a lot of process benefits and quality benefits afterwards. So you see with using the analyzer, of course, with the proper software in the background, you can reduce the LSF standard deviation.
you will see smaller impacts of discontinuities like stockpile and cone effects. you can run feeder corrections more dynamic to adapt it for different situations. In the process, this opens for you the possibility to use maybe more alternative fuels and you produce more consistent clinker. Now, switching to the second case, which is a cement plan in the us. and they already are very good equipped with two cross belt analyzers and a robotic laboratory, but they were still not happy. And for that purpose, they decided to go for our equipment. And one of the, let's say of the bottlenecks was the not too frequent sampling and sample analysis in the lab.
So they wanted to have a more frequent results to adapt for different steps in the process like the, the can carry over dust, et cetera. So here we see the installation itself. you see on the right picture, you see the S slide. And under the S slide, there is a sampling system. And via this pipe, the material goes directly here in a protected case, small container where our analyze is installed. And more or less how does it operate? And I, I forgot to mention that in the beginning this is an analyzer which you usually don't switch on and off because the analyzer gets the signals from the plant.
POC, when material is running, the POC takes care that that the sampler is switched on, the material goes into the analyzer, the material is analyzed and then returned. And of course, we have this backup sampler as well as an option. And more or less, the whole thing happens fully automatically. So there is no human interaction required also to start and stop by using the iOS from the sensors here, we have always fresh material in the analyzer. The analyzer will not run out of sample only when we get no signal from the plant, you'll see that material is flowing. Then we empty the analyzer, and then we, more or less, we put it to the sleep mode.
Now, if you look on the results and the impact on the process, you see here the black line in the middle of the diagram where in the beginning they had no analyzer, and then we started with the analyzer, and this was really the first startup period. So there could be improvements still in the feedback loop for the different feeders, et cetera, because we see here some periodic oscillations, but you see immediately the big outlays and the big variations, they are gone by using this analyzers. Now, I mentioned before that it'll also have impact on the clinker quality.
And by using this setup, I I can prove it that in certain cases it'll give you a lot of benefits because what you see that the clinker quality, and in this case, we specifically look on the alight concentration reduced the variability. So more or less we had before a standard deviation on the alight of 4.4, and after a more consistent Romeo, it went down to 3.6. And this also opened the possibility to increase the overall alight content in the clinker. So with this setup, and again, it was only based on the improvement of the characterization, so no other major changes were done at the plant, we could improve the allied concentration in the clinker from 60 to 64%.
And this will directly, more or less give you a lot of options to have benefits in the process, because by higher allied, you can reduce the clinker factor by adding more limestone, more fly flash or slack or other additives. It gives you the possibility to reduce the fuel, it reduces the energy, and therefore, by reducing fuel energy and the clink effect, you reduce also the CO2 emissions, which is one of the hot topics today. You can reduce the additive costs, you reduce the wear and tear by running the process more homogeneous, you may be able to reduce homogenization. there is a certain impact on the cement milling and on the clinker grinding.
And one thing I didn't show you in this presentation because of time reasons the analyzer can be via the software also taken out of the automation and be used for emergency cases as a backup of the lab equipment. And of course, the analyzer is so simple, so robust that it requires only 20 minutes to 30 minutes maintenance per week. So it's much, much less than the more complicated automatic laboratories. It is the key tool to give you a consistent high quality clinker. You can use this to reduce the clinker factor, and you can use the results of the analyzer to increase the utilization of alternative fuel.
And I, at the end, would like to thank you very much for your patience to listen to my talk and I will try to answer all the questions. If I'm not able here are my contact details, please send us a mail and I will try to give you an answer to, to all the questions you have. Thank you very much. Thank you very much, Roger. It's a, a really clear presentation outlining the, the benefits of, of this system. it's very compelling when, you know, you look at the operational benefits and obviously trends going forward are for increased clinker substitution increased alternative fuel utilization. So we can see very clearly the, the benefits of the the lower LSF, which is the key target here.
there's a, there are a few questions around the, I guess, comparing systems. one question relates to the US plant case where it, there was a cross belt analyzer and then you in, you installed your XRF analyzer. and the question is, did you, when you switched over how, can, can you just describe that process? Did you, did you close off one set of analyzers and then move over? what Was No, no, it's to make it very clear usually there are many plants that use two sets of analyzers okay. Analyze, and that's the cross build analyzer we don't intend to replace is for the course material coming from the quarry. So there is no impact with our analyzer. Okay.
But if you look on the raw mill before the mill, then of course there are certain components missing because it's only added in or after the mill. And we, and this is also the another question. What I saw is that by placing the sampling point after the raw mill, you have the complete mix, which will go into the kiln. So it's a no assumption about how much bypass task is added or other things. And by having this complete mix and a much better analytical quality of the data with X ref compared with a cross belt there, you get this, these benefits. So it's a kind of refinement and sophistication. you've got another, another level of control Yes. that you wouldn't have had before.
That's very clear. the questions around materials that you are analyzing one about, again, da coal is, is there an application for analysis of coal? I, I I don't have a, a proven concept for coal. I, I do know that in particular, in, in, in, in South Africa, coal analysis is done quite often with exa D methods to see the different minerals in the coal, but also with XRF to see the, the overall carbon content. So for such applications, our analyzer would be very, very good. But of course, the main thing which is my worry, is that we can handle the material in a proper way because the analyzer is designed for fine free flowing material.
And if his coal is in that type, then it's free flowing and, and we can handle it mechanically. Then I, I, I would be very happy to discuss what is possible for coal, but I don't have their a solution right from the, from the drawer at this point. Yeah. in terms of clinker analysis, is that the same issue in terms of handling it mechanically? No because for the clinker, we have two options. Either we use continuous disk mill before the material goes in, and that is something I did not show in the presentation. Usually if you sample clinker you need based on the bigger particle size, you need a bigger volume.
So usually if you have a, let's say average 20 millimeter clinker grains, you need to sample at least let's say eight kilograms to be a little bit representative, then the material is crushed, then transported via a vibration feeder mm-hmm into the crusher crushed after the crusher split, and then it goes through a continuous mill, and then the material leaving the mill is below a hundred micron usually, and then it goes into our analyzer. So this is a complete, we call it a sampling tower to do the whole job. Yeah. Got it. Okay. and then I guess the, this question maintenance, what kind of level of maintenance is required? I see that you contain it inside a kind of closed encased box.
So yeah, the, the box protective is good for, for, let's say for moderate moisture and the temperature range between minus 10 and plus 40 degrees. what I recommend is maybe to put a roof on top or in, in southern countries to put a little bit a shack around it with a, a very basic air con to be sure that the, the analyzer can run under these conditions. Mm-hmm. The weekly maintenance is maybe 20 minutes for experience guy, and it's very, it's mainly a cleaning task and a checking task once per year, we do the annual maintenance. So one of our specialists will come over to do this job.
We, we do have a network of specialists globally, so there are people in Europe, there are people in, in Australia, in Asia, in India, et cetera. So, so we can cover the whole world. Okay? but for troubleshooting, we also have usually a remote connection to the analyzer. And 95% of all let's say tasks can be handled via remote and also the analyzers equipped with a camera that we see what's going on into the analyzer, and we record always the last pictures that in case of an event that we can look back what was wrong, so was a cause particle blocking the, the, the disc or, or what happened.
And then usually the main issue that happens in, in real life is that there are issues with the material fee to dely and usually not India. Very good. Okay. Well, Roger, thank you very much Roger from SCT a really good presentation. lots of interesting information. there's a few questions that you might want, want to look at, but for all of you watching who want this presentation of course you'll receive it by email after the, the webinar. So thank you very much, Roger, Also, thanks a lot, and I appreciate to get the chance here. Thanks. Bye. Welcome. See, see you again. Yeah, sure. Okay. That's that's great. thanks to to Roger there.
we're going to now move into the last presentation that we have. Roger, if you could just unshare that, then we can we can get there we are Angelica up for the next presentation. So very pleased to welcome Angelica Ayana from Scan Tech who's gonna talk about improving process control in the cement industry using high specification, fully penetrative and representative real-time elemental analysis. Angelica is an accomplished electronic engineer with an MBA in project management. Currently, she serves as the Europe manager for SK Tech International, where she promotes products, supports customers understanding and manages sales opportunities.
Previously, she enhanced equipment performance as a service representative and led a maintenance team at Cemental San Marcos driving sufficient significant efficiency improvements. So she's been a customer so she's, she's seen every side of this. But your slide is up and you are ready to go. welcome Angelica. Thank you, Thomas. thank you all for the introduction and yeah, for everyone we are very happy to share with you our success in the cement industry and how our customers are getting benefit using our high specification analyzer. So we're just gonna go through the presentation for cement industry. I hope I'll answer all the questions when, if not feel free, email share details.
Little bit of overview about SK EC is an Australian company. We base in Adelaide, so our headquarters are in Adelaide. Everything we do, we build, we do it there, and then we ship our analyzers to any place in the world. We have around 400 analyzers installed around the, the world in more than 80 countries. our service engineers are located in each region. So for example, we have two engineers in laham, two engineers to cover Canada and United States, three engineers in Europe. So we try to cover all those regions where we have installations.
Those engineers are in, look at, are looking after our customers, so they go visit them for maintenance support, any remote support source to up, yeah, any, any technical work. scan has been world leader in Minero at the moment, so we have more than 40 years of experience doing this. elemental analysis and moisture, we started with coal, and then we moved to the cement industry and, and the past 20 years to the minerals. We are also in recycling steel, and now trying to get into alternative fuels as well for those cement producers that are now introducing alternative fuels in their processes. this is basically what we offer.
We guarantee the customers will be able to measure their materials in a representative way. So an online analyzer allows them to measure a hundred percent of the material that passes through the analyzer. So that means we don't have some, we, we basically don't have sampling error using the analyzer. It's a continuous measurement and time conveyor flow and is in real time. So we can deliver results from two minutes, and that will depend on, on the specification as well of the analyzers. We have analyzers in our industries measuring 30 seconds, every 30 seconds. So it's, is, is, is mainly based on the application, and that measurement allows customers to have control on their processes.
So once they have a representative data, once they have online reliable data, they can make any feedback or fit forward control that will therefore maximize the product value, minimize operation cost. those are the techniques that we have available. And those are the, the tech, the analyzers that we, we, we have for the cement industry. So we are gonna focus today in PGN aa, which is from gamma neutron activation analysis, which I'm, I'm really sure you know about this technique. However, I'm gonna, I'm gonna briefly explain how it works. this technique allow us to, to determine elemental composition in real time. So we, we have more than 200 Rs in, in cement industry in many applications.
we are gonna talk about also this technique you being used to measure quality in alternative fields. So you gonna see some study cases on, on those on this application, especially alternative fields. And yeah, let's move forward. You are gonna receive anyway, this presentation, so you will be able to look through it afterwards. So this is a little bit of our experience. We started in 1992 with call, and then we move forward to the rest of the industries. So stantech is the only company that has measured gold directly, so we have very good and strong capabilities. We are dedicated to online measurement. So this is our core and this is what we do.
And we, we have our own r and d who develops and is improving all the analyzers performance over the time. So as I mentioned before, yeah, we have 30 years in the cement industry and what we do is we convert rock to data using ove analyzers, and it's because it's a hundred percent of the material that passes through the analyzer will be analyzed that allow us to, to, to digitalize any process. So it's all about digitalization, and it's all about to have the control with real about data that without an on on belt analyzer wouldn't be possible. So yeah, basically this graph, this photo with the draft explained what we do. We have the rock here.
The material is converted in element results thats can use any time to make any control to keep track of their quality and so on. Those are the three applications where we have the RS getting benefits from customers stockpile and a control query augmentation, which is the one that is, is used to build stockpile and all the compositions according with what the, the plant is looking for. the raw mix control is the analyzer that is installed, installed right before the raw meal. So these analyzer is used to control the recipe or the raw, the raw mix recipe. And we have also the blend scan. She's the software that can automatically control the feeders of the omics.
So yeah, we are the only supplier that can provide average stockpile quality guarantees. So usually those guarantees that we usually the position that we guarantee at the beginning of any project are being exceeded over the time. And the reason is because we try to improve calibration of, of, of each the calibration of each site at least every six months or one year. So, and that allows them to exceed the expectations and also improve the precisions. those are benefits that we see customers are getting using the analyzer in stockpile and raw mill locations. So benefits in stockpiles reduce designation of of the materials.
yeah, it will be indeed optimization and optimization in, in the use of, of the raw materials as well as the curry life will increase and will, that is translated in the, in the maximizing the value or the materials. and before the raw meal customers are able to get outreach, the target in term of, of LSF in terms of LSF, AR or sr, which is, yeah, the, the, the most important here. And try to, to get a, in the less ation or variation in, in this quality before the mix. mixing silos, this is how it looks. The geoscan on a conveyor belt this is basically the installation of one geoscan. it goes through the conveyor belt.
It doesn't have contact underneath the, the convertor doesn't have contract con contact with the, with the analyzer, so we don't have wear parts. And we can deliver results, as I mentioned before every two minutes. as well as cumulative average for batch or shifts. Anything the customer will like to, to organize in terms of reporting, we can do that as well. We have the option to measure MO and be also integrated with developmental analyzer. So is this one that is here? This is the MO that works with microwave transmission as different to, to the pg a. we can deliver up 20 elements at the same time, very good positions, even in those elements that are with very low concentrations.
the positions we guarantee are co they cover the full range. So we, we calibrated with a, with a specific range of we, the procedures that they cover the food range and know the medians, which is something that make us different. this is how the use count works. The source we use is a California, and it's located at the bottom of the analyzer. So green you see here, signal that you see here is, is a neutral source that might emit up to hundred 50 millions of nutrients per second. So every time that the material passes through the analyzer, the elements they become, they become gamma rays. And we use the gamma ray to d terminate elemental composition.
So it is basically like having a fingerprint for each element. So that's why we can make the difference, we can make the difference in between the content on, on of each element on the materials. this is how the, the process and we report the, the data. You can see here every two minutes, you gonna have a new database on the previous two minutes average. So we collect the spectra and then we calculate and determine the element. and it's because it has a, a radioactive sort. it can mentioned our safety features. Jan is fully filled with cast nutrient shielding, which is material based on high density polyline beds, amor and polyester ine that does, that is a very good observer of nutrient.
the radiation around the analyzer is acceptable to a normal levels. However, we have and now tomatic or source drive that drives the source source to the rear of the analyzer every time that the material is passing or is every time that the conveyor belt stops. So if it is no, if it's for any reason the, the conveyor belt stops running, the source will be driving to the rear of the airlines. This feature can be also used to, for example, if we have many customers that they have like a they have lock the, the doors or the gates to the analyzer area, and they program an interlock with the analyzer.
So every time that someone opens the gates the source can be driving to the, to the rear of the analyzer for safety requirements, we're gonna go now through some cases studies on cement applications. So we're gonna go through stockpile applications and roll mill applications as well. alternative few alternative fields as well for you to, to understand more or less how we compare the performance of the analyzer. and yeah, this is basically the benefit the customer has is that we don't have sampling error. we use any way the laboratory da data to calibrate the analyzer, but after that is a hundred percent of the material that is gonna be measured. So it's, it's very beneficial.
this is one of the applications is in stockpile calcium, for example. So the the red one is the laboratory report. The blue one is the report. Very good correlation. the range, so you can feel the range here, 2050 of calcium. We other element here, aluminum. And so very good correlation in between the yield can laboratory. The good thing with the analyzer is that it's also following, I mean, it's if the, the laboratory is showing picks on any specific element, the analyzer responding the same way. Like for example, this one, this one is Romeo is a study this is a, that was well as the laboratory, what the customers course they expect.
this is more there couple of variations in same for aluminum and important to, to mention that Yeah, you can, is capable to, to pick up the variations. these are another example of raw mill. So basic, what we see in each graph, the comparison between the laboratory. So we have samples, those samples here, if I go back, the one to 109 samples are dynamic samples that customers, they take every hour, they do like a complex, sometimes it's two hours or one hour, and then they send that material to the laboratory.
And then we, we correlate the analyzer results with the laboratory results, and this is what we compare and that this is what we use to d terminate the performance as well as a, to calibrate the analyzer and do any adjustment if needed. this is more elements C is aluminum for, for the same application grow mill. we wanna go now to the scan case study. for alterna fuels, the bus scan is the same, pg NAA we call it buzz scan because it's, it is our analyzer for alternative use, but it basically the same technique. So it works with a California source, 200 52, and it's the same configuration at the bottom, detectors at the top. those are some results. calorific value in alternative fields.
again, we, we compare the laboratory results with the, with the base scan. In this case calorific value curing we have also ash content that is calculated base as well as the calorific value is calculated using the elemental elemental analysis. So we use the elemental analysis to calculate the ash and calorific value chlorine is measured directly. that was quick. Thank you. Any questions? I'm happy to, to answer. Thank you very much. Angelica, yeah, that was a, a great rapid look through the products you have on, on offer very very interesting the alternative fuels, is that, is that something that's becoming more and more in demand? Are you seeing quite a lot of people interested in that?
Yes. For any reason? I don't have a video. Alright, there you go. It's working now. it is indeed now customers are using more alternative fuels. we have customers currently using more than 80 80% on, on their process the alternative views to, to fit the Ks. And it's becoming very important for them to know those values before the material is burned, which is already too late. So, yeah, that's why we, we introduced to them the bus scan that helps them to receive the materials, try to analyze them in a convert belt. They have the option as well to put the, put the material in big bags. So that is that is like an static analysis Mm-Hmm.
But when they receive the material, so before they're gonna process any material they, they know what is the calorific value and yeah, how they, they're gonna manage with that, so, which is very important. Yeah, okay. For sure. And is that something more in, more in Europe I guess where the, where these alternative fuels are, are used at higher levels? but one, one other question that's just thinking about the radioactive source. how, how easy is it to, you know, in which countries is it available? Is, are there restrictions and limitations? from that spec perspective, We've been supplying Californian sources in more or less 80, 80 countries.
We didn't, we haven't faced any issues in, in, in those countries. we just need to apply to, to the, the customers, they apply for the license and we help them with all the information that they're required. I'm aware there are some restrictions in France, but it's a matter to, to, to apply to the license. try to deal with that. But yeah, it's a process that you, a process that usually takes six months and we prepare the customer with all the documents, all the documentations, they, they will need for that. So we have the license for handling sources, which is what mainly they will need. Yeah, sure. there's a question here, just a practical one.
how do you achieve efficient belt load to analyze alternative fuels by the P-P-G-N-A? So these are good question. Thank you. In the basically past months, we weren't able to measure below 20 kilograms per meter. So now we are, so we have developed a patent that is in process to be launched that allow us to measure 10 kilograms per meter of belt load, which is very good for, for alternative fuel because we understand basically the reason we developed this feature was because alternative fuel producers, they, they came to us asking for low belt laws. They, they don't process huge amounts of material. So we have the option now to deal with that, so no problem.
Yeah, I guess if it's the biomass or fluff RDF, they're, you know, less dense. so that's something that you've been able to, to solve. That's that's excellent. okay. and that, that's that's it for now. in terms of the questions I'm sure there may be others. please contact Angelica by the email. it'll be on her presentation slides when you receive them. But for now, thank you very much for that presentation. Thank you. Well, that draws us to the close of today's session. Thank you very much to all our speakers. it's been very comprehensive. I hope you've had a lot of your interests satisfied. and if you have questions please do go back to our exceptional panel.
big thank you to scan tech to SCT FL Schmidt and Thermo Fisher Scientific. that's it for cement plant quality control. for this month, do join us again. we won't be having a webinar in August, but we'll be back in September. but in the meantime do remember we'll be also in Warsaw for Cemtech Europe. we've got a wonderful program coming together two days in, in Warsaw, in Poland covering all aspects of the cement manufacturing technology, focusing in on decarbonization a special dedicated session or two to carbon capture utilization and storage. and as usual the same networking exhibition and plant or, so I hope to see you in your in the meantime enjoy the rest of your week.
thank you very much for attending this webinar. Goodbye. Thank you very much. And bye-Bye.
Video library
Browse 410 conference presentations, webinars, interviews and technical films from the modern CemNet video archive.
410 videos
2 September 2026

1 July 2026

1 July 2026

30 June 2026

30 June 2026

30 June 2026

30 June 2026

30 June 2026

30 June 2026

30 June 2026

30 June 2026

3 June 2026

13 May 2026
9 April 2026

1 April 2026

4 March 2026

27 February 2026

27 February 2026

27 February 2026

27 February 2026

27 February 2026

27 February 2026

17 February 2026

11 February 2026

7 January 2026

3 December 2025

5 November 2025

16 October 2025

8 October 2025

3 September 2025

2 July 2025

4 June 2025

7 May 2025

2 April 2025

18 March 2025

18 March 2025

5 March 2025
3 March 2025

5 February 2025

8 January 2025

4 December 2024

13 November 2024

6 November 2024

9 October 2024

4 September 2024

3 July 2024
10 June 2024

5 June 2024

8 May 2024

23 April 2024

23 April 2024

23 April 2024

23 April 2024

23 April 2024

22 April 2024

22 April 2024

16 April 2024

16 April 2024
11 April 2024

3 April 2024

11 March 2024

6 March 2024

7 February 2024

10 January 2024

10 January 2024
10 January 2024

6 December 2023

1 November 2023

4 October 2023
15 July 2023

15 July 2023

15 July 2023

15 July 2023

13 July 2023

24 March 2023
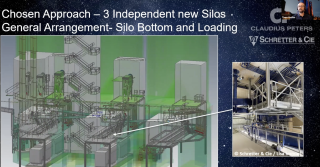
14 July 2022
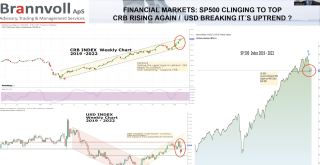
13 July 2022
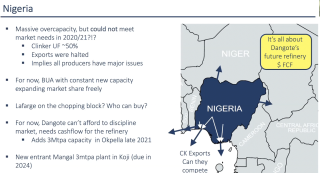
12 July 2022
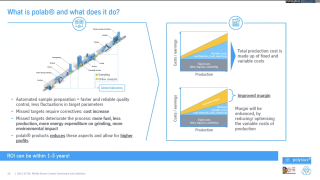
12 July 2022
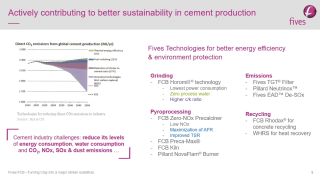
12 July 2022
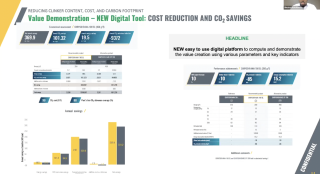
12 July 2022
12 July 2022
12 July 2022
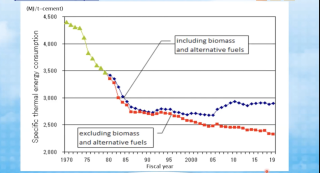
12 July 2022
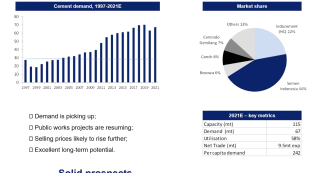
12 July 2022
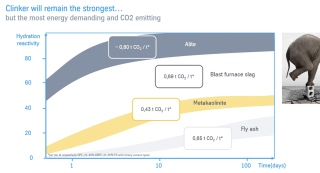
12 July 2022
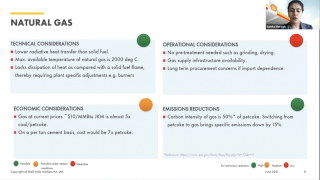
12 July 2022
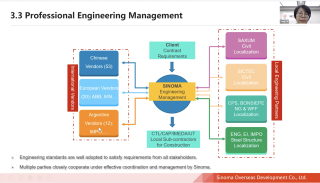
12 July 2022
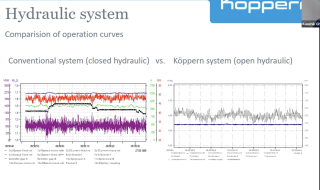
12 July 2022
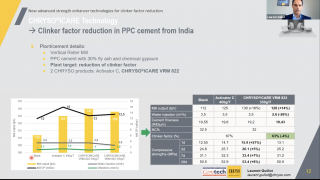
12 July 2022
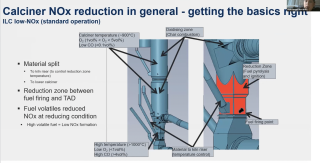
12 July 2022
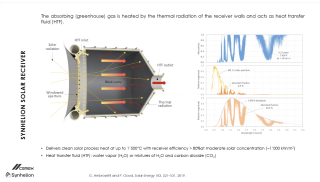
12 July 2022
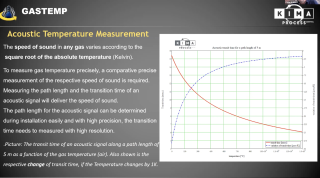
11 July 2022
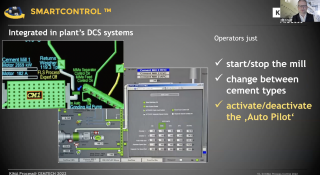
11 July 2022
11 July 2022
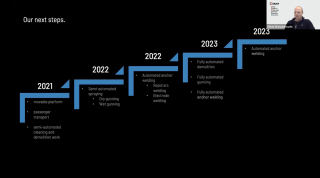
11 July 2022
11 July 2022
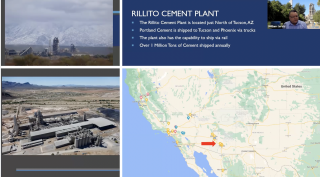
11 July 2022
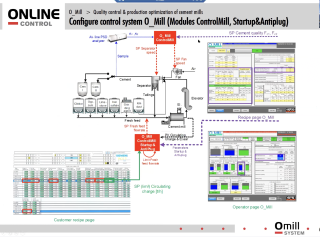
11 July 2022
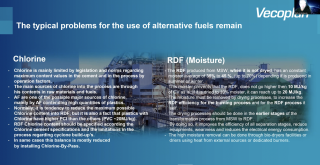
11 July 2022
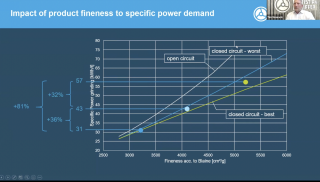
11 July 2022
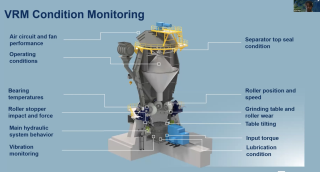
11 July 2022
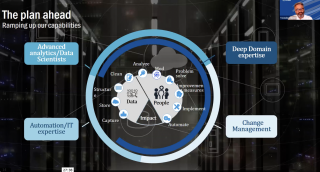
11 July 2022
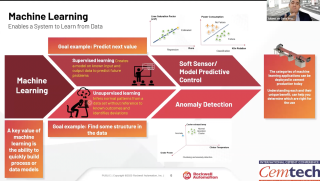
11 July 2022
11 July 2022
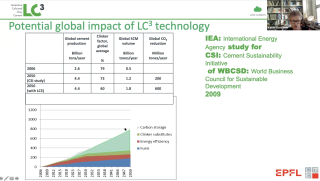
11 July 2022
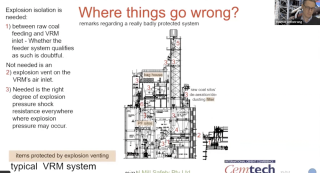
11 July 2022
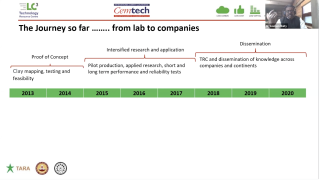
11 July 2022
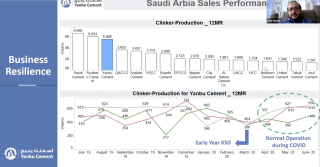
11 July 2022
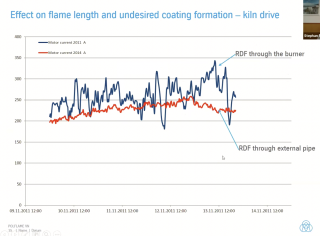
11 July 2022
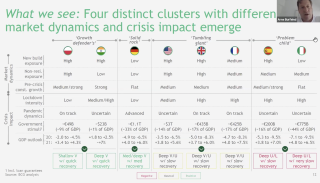
11 July 2022
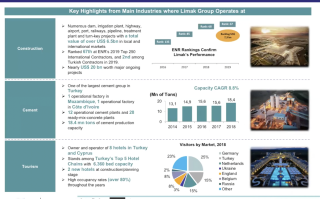
11 July 2022
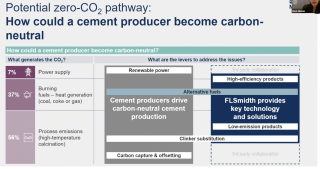
11 July 2022
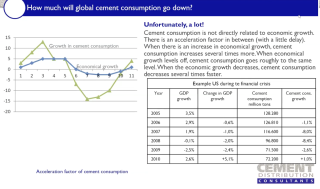
11 July 2022
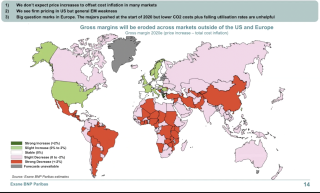
11 July 2022
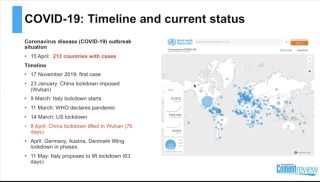
11 July 2022

6 July 2022
1 July 2022
1 July 2022

8 June 2022

12 February 2021
12 February 2021
12 February 2021
12 February 2021
12 February 2021
12 February 2021
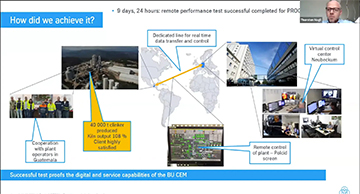
12 February 2021
12 February 2021
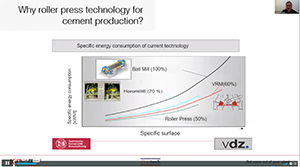
25 September 2020
25 September 2020

25 September 2020
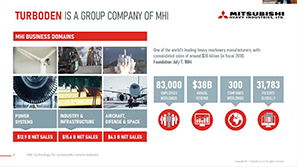
25 September 2020
23 September 2020
22 September 2020
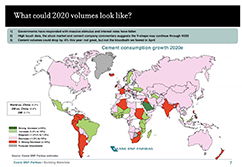
22 September 2020
21 September 2020
20 February 2020
10 February 2020
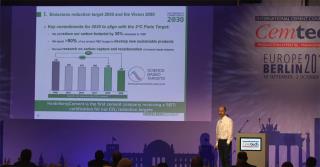
10 February 2020
10 February 2020
7 February 2020
27 January 2020
23 January 2020
23 January 2020
23 January 2020
23 January 2020
2 May 2019
30 April 2019
18 April 2019
18 April 2019
18 April 2019
12 April 2019
12 April 2019
11 April 2019
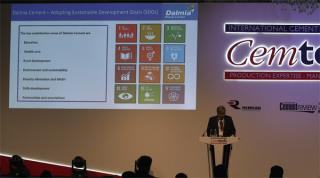
10 April 2019
10 April 2019
10 April 2019
9 April 2019
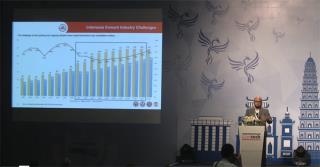
9 April 2019
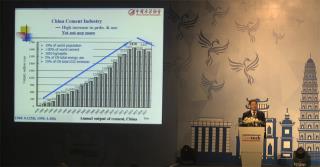
4 February 2019
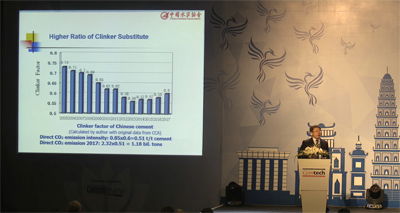
17 January 2019
31 July 2018
31 July 2018
31 July 2018
27 July 2018
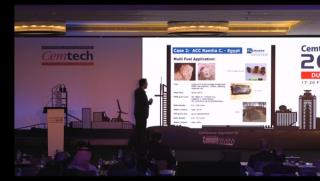
27 July 2018
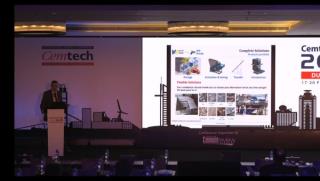
27 July 2018
27 July 2018
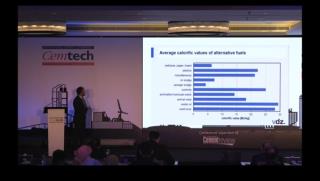
27 July 2018
27 July 2018
27 July 2018
27 July 2018
27 July 2018
27 July 2018
25 July 2018
25 July 2018
25 July 2018
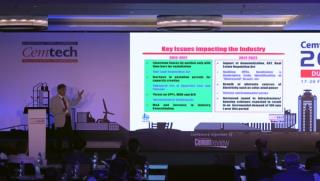
24 July 2018
24 July 2018
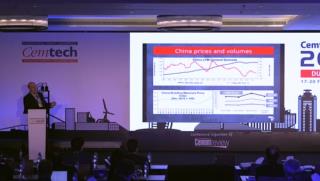
24 July 2018
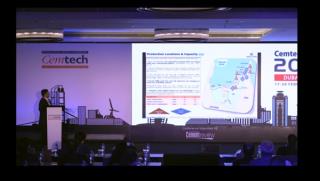
23 July 2018
23 July 2018
23 July 2018
20 July 2018
20 July 2018
20 July 2018
20 July 2018
20 July 2018
20 July 2018
20 July 2018
20 July 2018
20 July 2018
20 July 2018
20 July 2018
20 July 2018
20 July 2018
20 July 2018
20 July 2018
20 July 2018
20 July 2018
20 July 2018
20 July 2018
19 July 2018
19 July 2018
19 July 2018
19 July 2018
19 July 2018
23 March 2018
23 March 2018
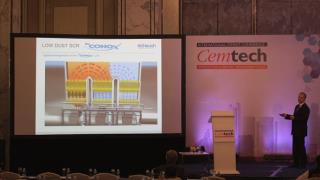
23 March 2018
23 March 2018
23 March 2018
23 March 2018
23 March 2018
23 March 2018
23 March 2018
23 March 2018
23 March 2018
23 March 2018
23 March 2018
23 March 2018
23 March 2018
22 March 2018
26 October 2017
26 October 2017
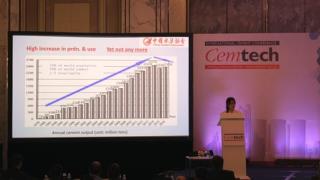
26 October 2017
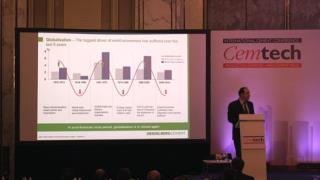
26 October 2017
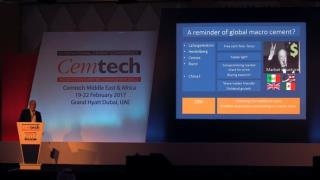
14 August 2017
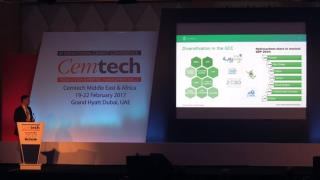
14 August 2017
14 August 2017
14 August 2017
14 August 2017
14 August 2017
14 August 2017
14 August 2017
14 August 2017
14 August 2017
14 August 2017
14 August 2017
14 August 2017
14 August 2017
18 July 2017
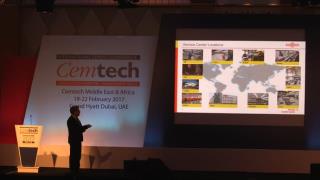
18 July 2017
18 July 2017
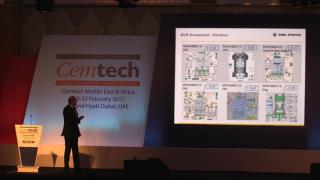
16 June 2017
16 June 2017
16 June 2017
16 June 2017
16 June 2017
14 February 2017
14 February 2017
14 February 2017
14 February 2017
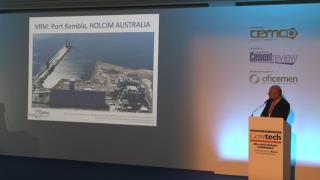
14 February 2017
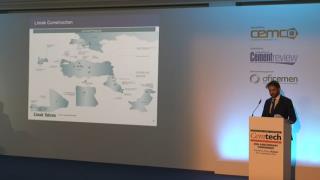
14 February 2017
14 February 2017
14 February 2017
14 February 2017
14 February 2017
13 February 2017
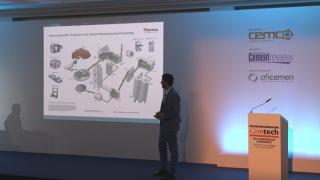
13 February 2017
13 February 2017
19 January 2017
19 January 2017
17 January 2017
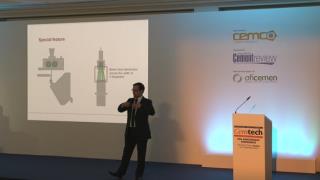
17 January 2017
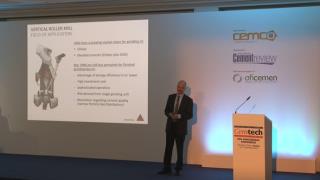
17 January 2017
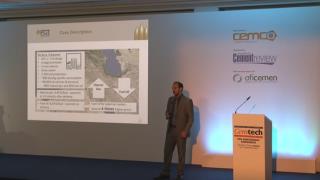
6 January 2017
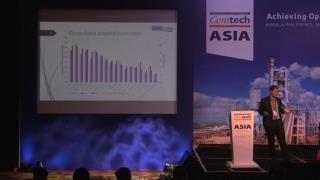
18 August 2016
18 August 2016
18 August 2016
18 August 2016
17 August 2016
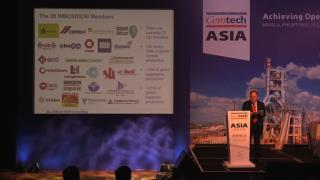
17 August 2016
17 August 2016
16 August 2016
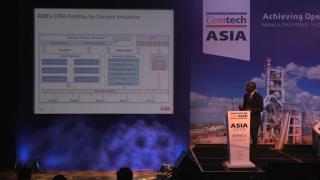
16 August 2016
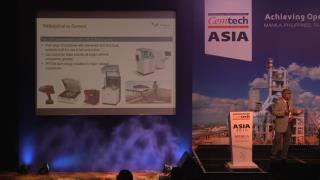
16 August 2016
12 August 2016
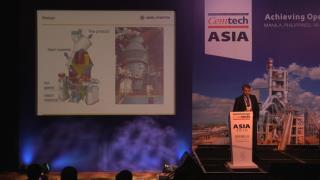
12 August 2016
12 August 2016
11 August 2016
11 August 2016
11 August 2016
10 August 2016
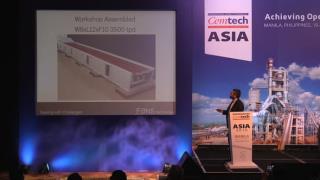
10 August 2016
10 August 2016
8 August 2016
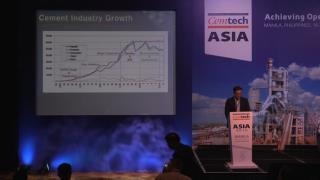
8 August 2016
8 August 2016
6 May 2016
6 May 2016
6 May 2016
6 May 2016
6 May 2016
6 May 2016
6 May 2016
6 May 2016
6 May 2016
6 May 2016
6 May 2016
6 May 2016
6 May 2016
6 May 2016
6 May 2016
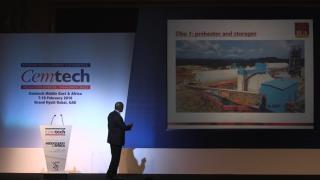
6 May 2016
6 May 2016
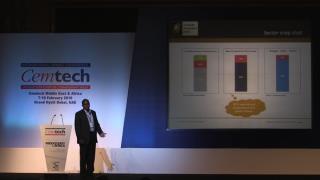
6 May 2016
6 May 2016
6 May 2016
6 May 2016
25 April 2016
25 April 2016
11 March 2016
11 March 2016
11 March 2016
11 March 2016
11 March 2016
11 March 2016
11 March 2016
11 March 2016
11 March 2016
11 March 2016
11 March 2016
11 March 2016
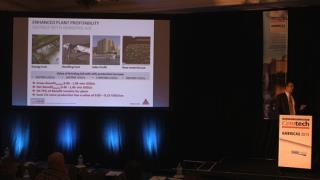
11 March 2016
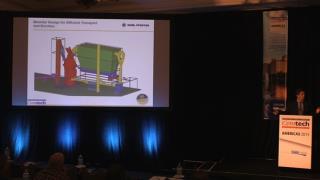
11 March 2016
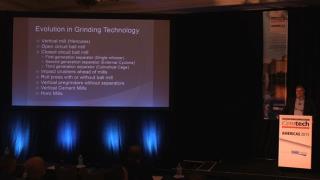
11 March 2016
11 March 2016
11 March 2016
11 March 2016
11 March 2016
11 March 2016
21 December 2015
15 December 2015
15 December 2015
15 December 2015
15 December 2015
15 December 2015
15 December 2015
15 December 2015
15 December 2015
15 December 2015
15 December 2015
15 December 2015
15 December 2015
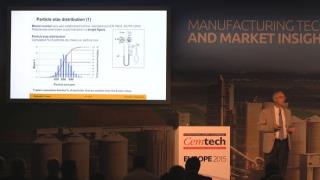
2 December 2015
2 December 2015
2 December 2015
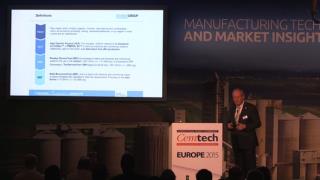
2 December 2015
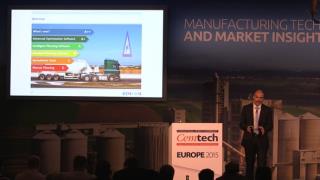
2 December 2015
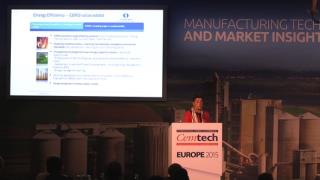
2 December 2015
2 December 2015
2 December 2015
2 December 2015
2 December 2015
2 December 2015
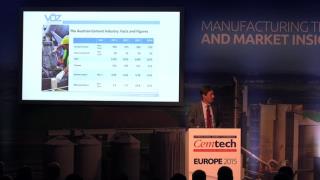
2 December 2015
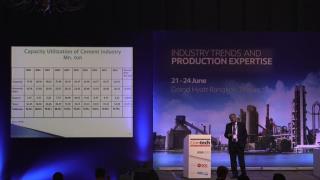
21 August 2015
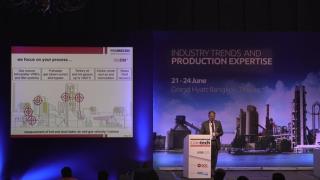
21 August 2015
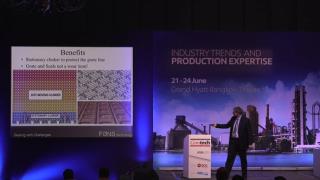
21 August 2015
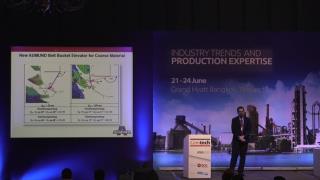
21 August 2015
21 August 2015
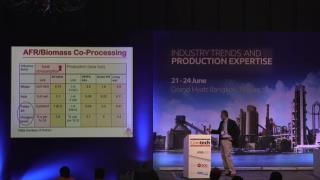
21 August 2015
21 August 2015
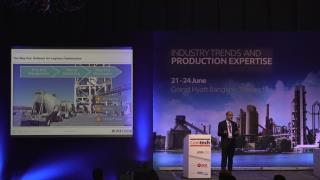
21 August 2015
21 August 2015
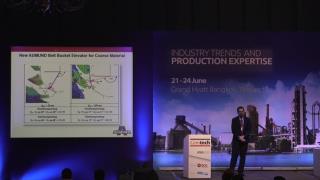
21 August 2015
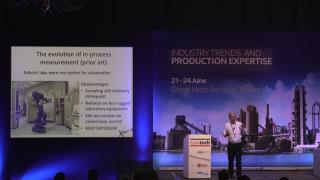
21 August 2015
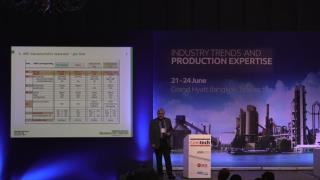
21 August 2015
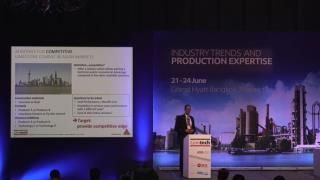
21 August 2015
21 August 2015
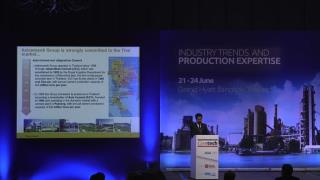
21 August 2015
21 August 2015
21 August 2015
21 August 2015
21 August 2015
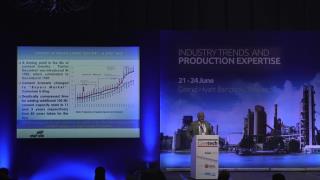
21 August 2015
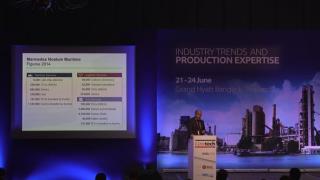
20 August 2015
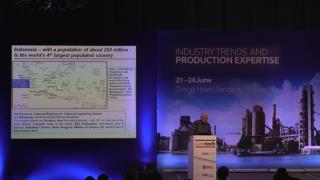
20 August 2015
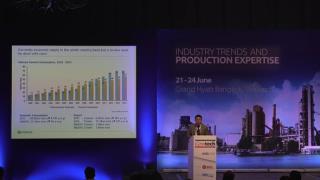
18 August 2015
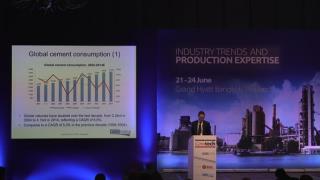
18 August 2015
18 August 2015
18 August 2015

30 June 2015
29 June 2015
29 June 2015
29 June 2015
29 June 2015
29 June 2015
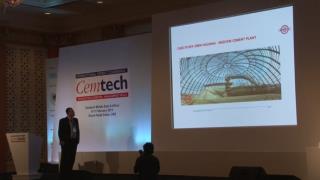
29 June 2015
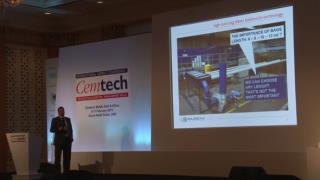
29 June 2015
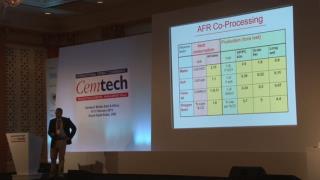
29 June 2015
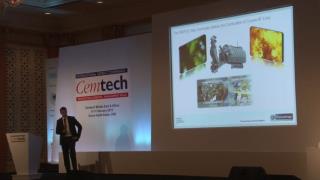
29 June 2015
29 June 2015
4 June 2015
4 June 2015
2 June 2015
2 June 2015
2 June 2015
2 June 2015
29 May 2015
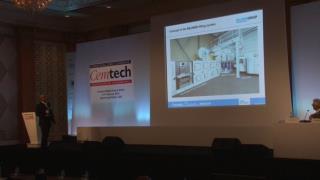
29 May 2015
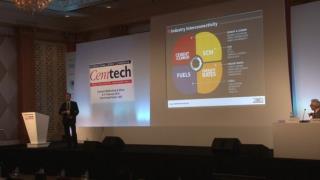
28 May 2015
28 May 2015
28 May 2015
18 February 2015
17 February 2015
13 February 2015
13 February 2015
Try searching for another title.