Cemtech MEA 2025
Cemtech Europe 2024
Cemtech ASIA 2024
Cemtech MEA 2024
Panel Discussion: Manufacturing low carbon cements
Panel Discussion: Cutting-edge technologies for low-carbon cement production
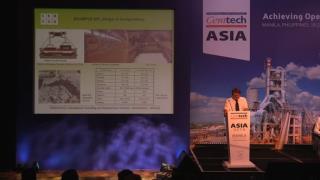
CO2 reduction combined with new concept for CI by-pass: Hans Jorgen Ibsen Nielsen, LV International Co Ltd (Thailand)
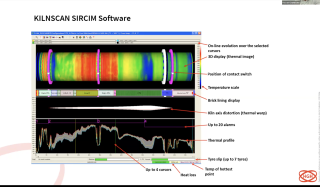
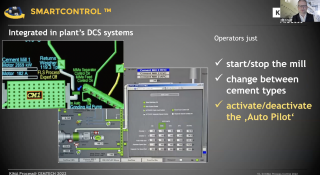
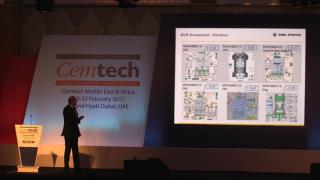
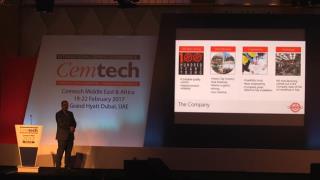
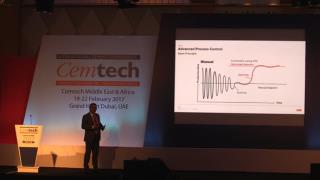
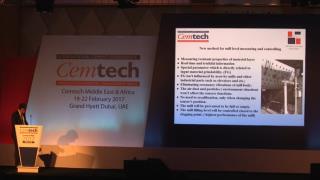
Process knowledge that creates instruments for AI - Dirk Schmidt, Kima Process Control (Germany)
Cemtech MEA 2024 Highlights
Cemtech Europe 2023
Technologies and solutions for the transformation of the cement industry: Matthias Mersmann, CTO, KHD Humboldt Wedag

Cemtech Europe 2023 Highlights video
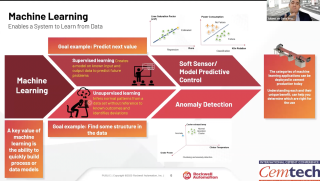
How to combine ML/AI and IoT for plant monitoring, control and optimisation: Juliano de Goes Arantes, Rockwell Automation (Switzerland) & Danijel Koren, NEXE dd (Croatia)
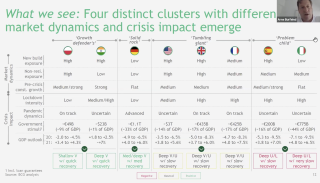
Cement industry business models through the net zero transition: Fabian Apel, Associate Partner McKinsey & Co (UK)
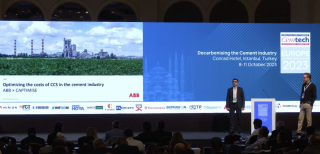
Optimising the costs of CCS: Ilten Karadag, ABB (Turkey) & Mattias Jones, Captimise (Sweden)
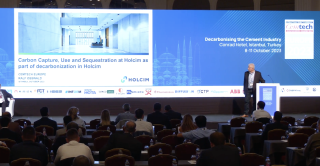
CCUS as part of decarbonisation at Holcim: Ralf Osswald, Holcim (Switzerland)
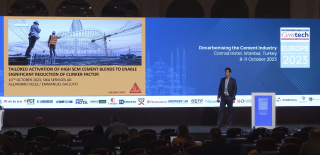
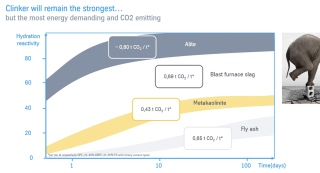
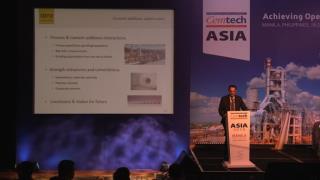
Tailored activation of high SCM cement blends to enable significant reduction of clinker factor: Alejandro Velez, Sika Services AG (Switzerland)
The portfolio of low carbon cements: Peter Hoddinott, Independent Consultant (UK)
Cemtech Asia 2023
Cemtech Asia 2023 Highlights Video
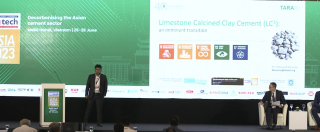
Limestone Calcined Clay Cement (LC3) – an imminent transition: Dr Debojyoti Basuroy, Development Alternatives Group
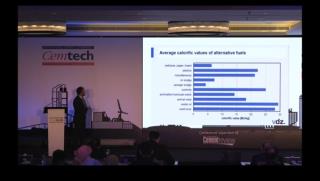
Alternative fuel resource utilisation and optimisation/reduction in specific heat: Vijay Arumugam, thyssenkrupp Polysius
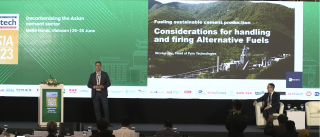
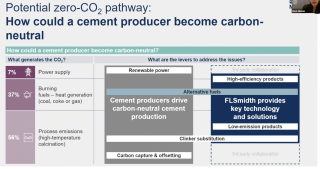
Fuelling sustainable cement production – considerations for handling and firing alternative fuels: Nicolas Bec, FLSmidth (Denmark)
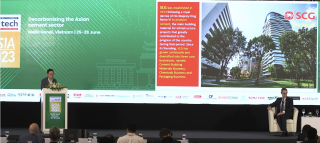
Advanced sustainability and carbon reduction plans including CCUS: Manasit Sarigaphuti, SCG Group (Thailand)
Cemtech MEA 2023
Cemtech Webinar 2022
Cemtech Live Webinar: Bulk material handling for cement plants and terminals
Cemtech Live Webinar: Technologies for the production of low-carbon cement
Cemtech Live Webinar: Process Optimisation
Cemtech Live Webinar: Technologies for emissions reduction
Cemtech Live Webinar: Optimising the grinding process
Cemtech Live Webinar: Digitalisation opportunities in cement plants
Cemtech Live Webinar: Cement Plant Maintenance & Asset Reliability
Cemtech MEA 2022

Cemtech Americas 2021
Cemtech Asia 2021
Cemtech Webinar 2021
Cemtech Live Webinar: Cement plant emissions monitoring & control
Cemtech Live Webinar: Advanced pyroprocessing and kiln control technologies
Cemtech Live Webinar: Digital Plant & Industry 4.0 Technology
Cemtech Live Webinar: Energy reduction in cement plants
Cemtech Live Webinar: Quality Control for cement plants
Cemtech Live Webinar :Alternative Fuels Best practice
Cemtech Live Webinar: Mastering grinding technologies
Cemtech Live Webinar:Cement Plant Maintenance
Cemtech Live Webinar: Digitalisation & cement plant optimisation – Part 2
Cemtech Live Webinar: Digitalisation & cement plant optimisation – Part 1
Cemtech Live Webinar: Bulk materials handling for cement plants and terminals
Cemtech Webinar 2020
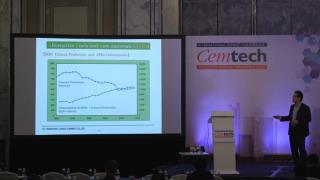
Cemtech Live Webinar: Cement and energy markets update
Cemtech Live Webinar: Clinker reduction technology
Cemtech Live Webinar: Conventional Kiln Fuels – preparation, storage and safety
Cemtech Live Webinar: Clinker reduction advances in Asia
Cemtech Live Webinar: World Markets, Energy, Freight Update
Cemtech Live Webinar:Optimise your kiln
Cemtech Live Webinar: Planning for the post-covid recovery
Cemtech Live Webinar: Global Cement Market Update
Cemtech Live Webinar: Best practice alternative fuels utilisation in cement plants
Cemtech Live Webinar: Impact of COVID-19 on the global cement trade
Cemtech Live Webinar- COVID-19: Global Cement Markets, Asia Focus and Plant Operations
Cemtech Live Webinar: Impact of Covid19 on the cement industry
Cemnet Webinar: Cement Plant Maintenance
Cemtech MEA 2021

Cemtech Middle East & Africa 2021 - Session 1, Keynotes
Cemtech Middle East & Africa 2021 - Session 2, General Practice
Cemtech Middle East & Africa 2021 - Session 3, Market reports
Cemtech Middle East & Africa 2021 - Session 4, Calcined clays
Cemtech Middle East & Africa 2021 - Session 5, African markets and financial analysis

Cemtech Middle East & Africa 2021 - Session 6, Pyroprocess and alternative fuels
Cemtech Middle East & Africa 2021 - Session 7, Plant operations and optimisation
Cemtech Middle East & Africa 2021 - Session 8, Clinker reduction and grinding
Cemtech Virtual 2020
Cemtech Virtual Event - Decarbonising the cement industry, Session 8
Cemtech Virtual Event - Decarbonising the cement industry, Session 7
Cemtech Virtual Event - Decarbonising the cement industry, Session 6
Cemtech Virtual Event - Decarbonising the cement industry, Session 5
Cemtech Virtual Event - Decarbonising the cement industry, Session 4
Cemtech Virtual Event - Decarbonising the cement industry, Session 3
Cemtech Virtual Event - Decarbonising the cement industry, Session 2
Cemtech Virtual Event - Decarbonising the cement industry, Session 1
Cemtech Europe 2019
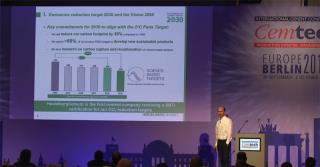
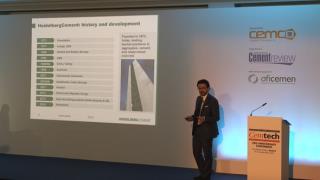
HeidelbergCement’s climate protection strategy and Vision 2050 - Peter Lukas, HeidelbergCement (Germany)
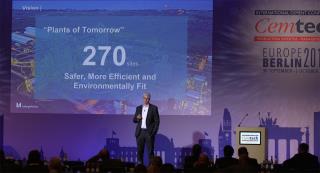
Laurent Seyler and Daniel Reiser, LafargeHolcim (Switzerland): Cement Plants of Tomorrow – Westküste 100
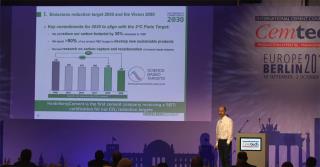
Peter Lukas, HeidelbergCement (Germany) - HeidelbergCement’s climate protection strategy and Vision 2050
Koen Coppenholle, CEMBUREAU (Belgium) - A competitive European cement industry to drive down CO2 emissions along the value chain
Martin Schneider, VDZ (Germany) - The German cement industry – market trends and technological development
Cemtech Asia 2019
Nouzab Fareed, Pacific Cement (Fiji) - Cement in the South Pacific
Peter Storer, FCT Combustion (Australia): Recent advances in raw meal control – a case study of clinker variability reduction
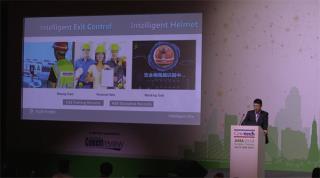
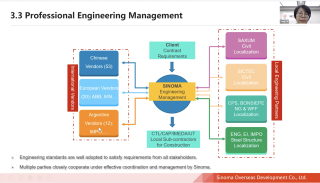
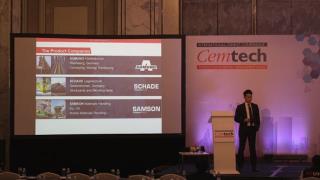
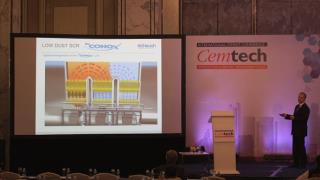
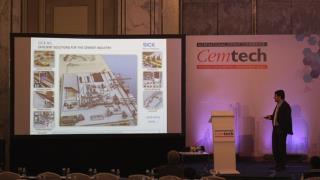
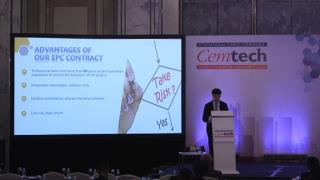
Daliang Chi, Sinoma CBMI Construction Co Ltd (China): Intelligent construction – a new EPC approach
Aidan Lynam, Chip Mong Insee Cement Corp (Cambodia): Well underway towards a sustainable future.
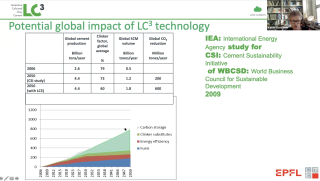
Laurent Grimmeissen, CEMENTIS GmbH (Switzerland) LC3: a breakthrough for the cement industry
Cemtech MEA 2019
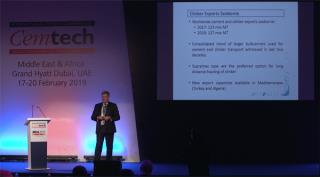
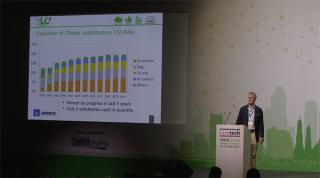
Javier Martinez Goytre, GlobBULK Consulting (Spain) - Clinker export considerations – light assets vs traditional shiploading facilities
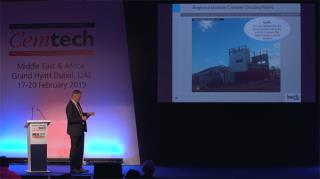
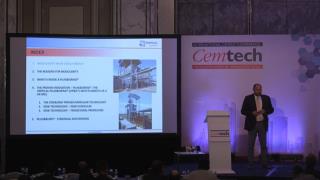
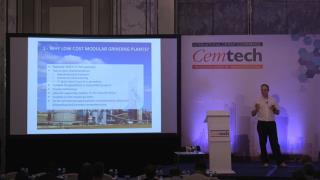
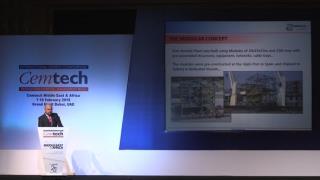
Olaf Michelswirth, Intercem Engineering GmbH - First European network of regional modular grinding plants
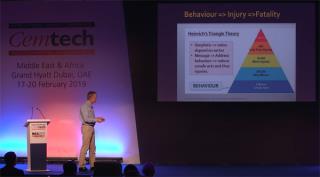
Peter Hoddinott, Peter Hoddinott Consulting (UK) - Health and safety leadership in cement manufacturing
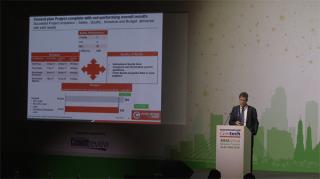
Arif Bashir, DG Khan (Pakistan) - Construction and commissioning of Pakistan’s largest cement plant
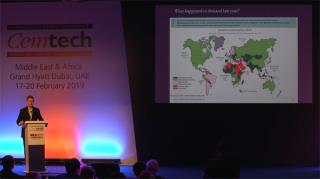
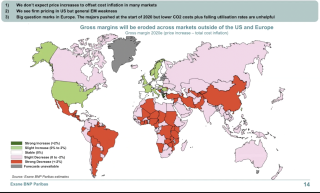
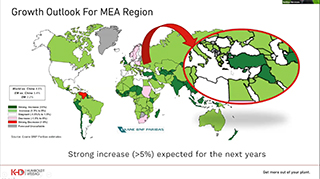
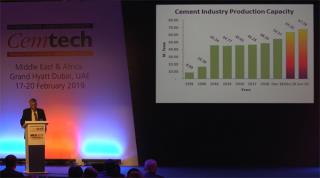
Paul Roger, Exane BNP Paribas (UK) - Outlook for global cement markets 2019-22
Cemtech Europe 2018
Oral Türesay, KHD Humboldt Wedag (Germany) - A new approach to burning alternative fuels
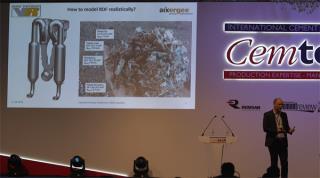
Matthias Mersmann, Aixergee GmbH (Germany) - Successful optimisation of a secondary-fuel-fired calciner – A case study.
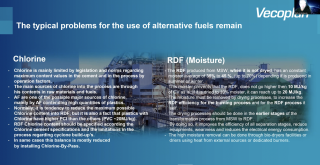
Tim Hamer, Vecoplan (Germany) - Best practice preparation of refuse-derived fuel (RDF) for the calciner and main burner
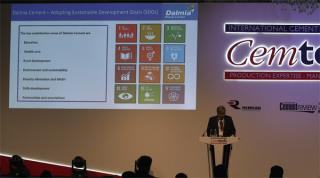
Ashwani Pahuja, Dalmia Cement (India) - Keynote on sustainable cement manufacturing.
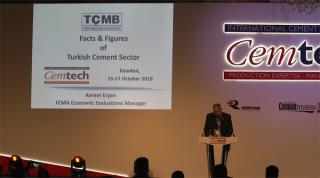
Kerem Ersen, TCMA (Turkey) - The Turkish cement industry
Cemtech Asia 2018
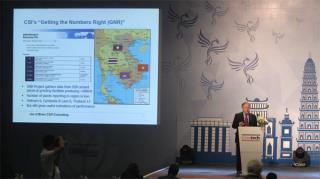
Jim O’Brien, Jim O’Brien CSR Consulting (Ireland) - Turning sustainability into profitability in Vietnam, Cambodia, Laos and Thailand
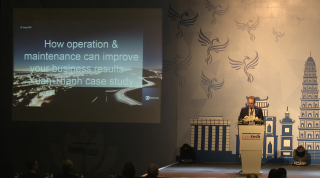
Martin Pedersen & Stephen Farren, FLSmidth (Denmark) - Xuan Thanh case study
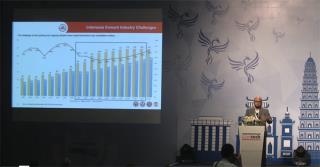
Adi Munandir, PT Semen Indonesia - Indonesian cement industry, opportunities and challenges.
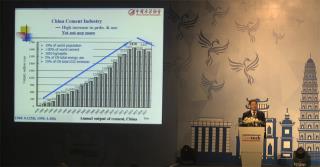
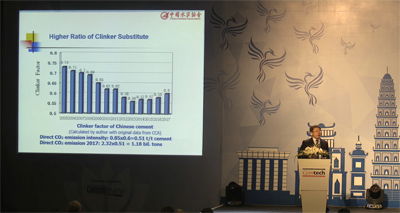
Dr Tongbo Sui, CCA (China) - Progressing towards a sustainable Chinese cement industry
Dr Yourong Chen, Vice Chief Engineer, South Cement Co Ltd/CNBM Group (China) - Technology trends for energy saving and emissions reduction in China
Cemtech MEA 2018
Hamid Reza Tajik, Cement Industry Export Development Co. (Iran) - Iran export trade and internal market review
Steffen Dalsgaard Nyman, CC Jensen A/S (Denmark) - Increase uptime and reliability with oil contamination control
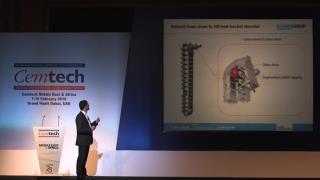
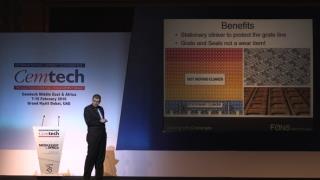
Mogens Juhl Føns, Fons Technology International (Turkey) - Cooler modernisation and performance upgrade
Dr Michael Enders, thyssenkrupp Industrial Solutions AG (Germany) - Quality control for a smooth kiln operation and good clinker quality
Robert Krist, FLSmidth Pfister (Germany) - Preparing for the future with alternative fuels
Luc Reibel, Walter Materials Handling / ATS Group (France) - Case studies: storage, extraction, dosing and feeding of shredded wood and tyres
Juliano Arantes, ABB (Switzerland) - How digitalisation helps to maximise alternative fuels in a cement plant
Nijat Orujov, VDZ (Germany) - Optimisation of the clinker burning process when using alternative fuels in cement kilns
Jim O’Brien, Jim O’Brien CSR Consulting (Ireland) - Turning sustainability into profitability in the Middle East
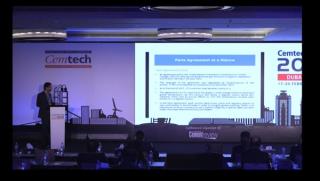
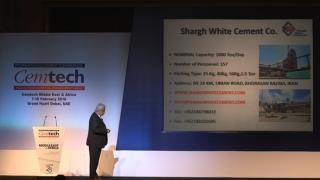
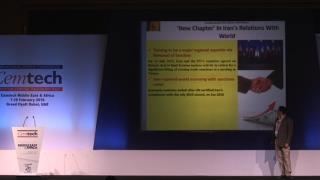
Hassan Tajeddin, Shargh White Cement Co, (Iran) - Paris agreement, Iran’s commitment and solutions
Dr Mathis Reichert, Loesche GmbH (Germany) - Successful scale-up into the unknown
Christian Altherr, Gebr Pfeiffer (Germany) - Implementation of two petcoke grinding units at RAK WCC plant
Adib El Hachem, Cimenterie Nationale SAL (Lebanon) - Market developments in the Levant and vertical integration strategies
Irfan Amanullah, Attock Cement - Pakistan’s high-growth market and industry expansion
Amr Nader, Yanbu Cement (Saudi Arabia) - A journey of transformation towards sustained plant efficiency at Yanbu Cement
Peter Hoddinott, Independent Consultant (UK) - Marketing – strategies for entering new cement markets
Saumen Karkun, Holtec Consulting (India) - Addressing the impact of external influences on performance outcomes
Olaf Michelswirth, Intercem Engineering (Germany) - Connecting Africa, grinding station and integrated logistics case study
Tony Hadley, Tony Hadley African Advisory - Sub-Saharan Africa – M&A and corporate developments
Syed Hasan, HBS Global (UAE) - Analysing the UAE cement industry – a review of supply & demand
Santhosh Balakrishnan, Riyad Capital (Saudi Arabia) - Saudi cement industry status and 2018 forecast
Hettish Karmani, U Capital (Oman) - GCC cement markets outlook
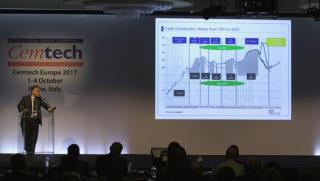
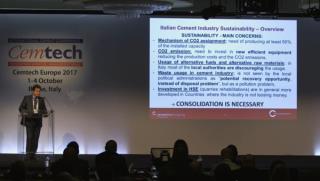
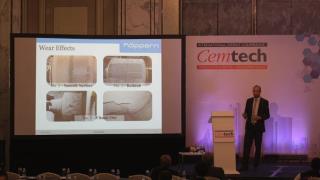
Cemtech Europe 2017
Matteo Manghi, Martin Engineering (Italy) - Advances in air cannon nozzles to improve pyroprocess performance.
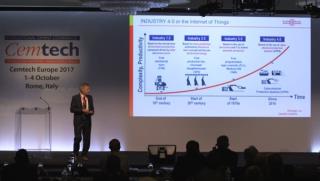
Karsten Horn, INFORM GmbH (Germany) - From transportation to transformation – the rise of the digital workforce in cement logistics.

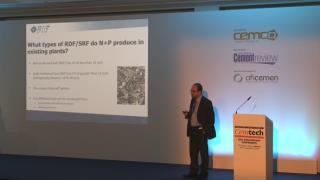
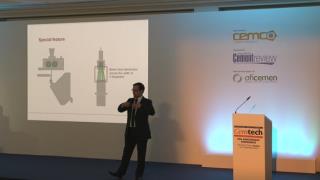
Brian Smith, N+P Alternative Fuels (UK) - Innovative technology for ESP and high temperature filtration upgrades.
Guido G Ceccherelli, EcosprayTechnologies Srl (Italy) - Innovative technology for ESP and high temperature filtration upgrades
Claus Fritze, Lechler GmbH (Germany) - Gas conditioning processes for the cement industry – high efficiency SNCR and gas cooling
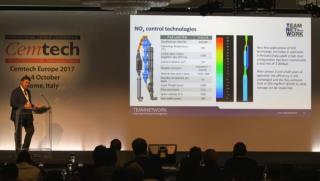
Roberto Fedi, Teamnetwork Srl (Italy) - Meeting stringent NOx limits with innovative SCR technology.
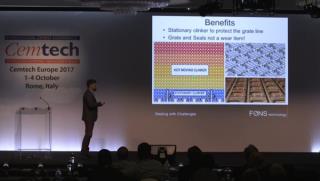
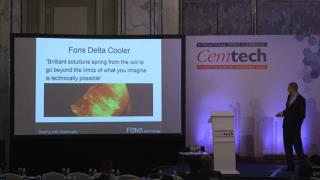
Firat Aslan, DAL Engineering Group (Turkey) - Working concept of the FONS Delta Cooler and DAL pyroprocess design
Basri Ogut, Walter Materials handling / ATS Group (France) - Best practices of alternative fuel dosing & feeding installations – case study
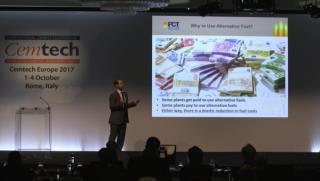
Joel Maia, FCT Combustion GmbH (Germany) - An alternative fuels programme - the model approach
Gary Heath, Castolin Eutectic (Switzerland) - How the cement industry can benefit from Maintenance 4.0
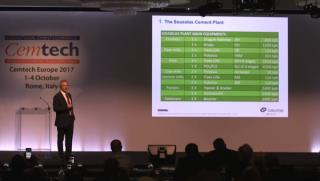
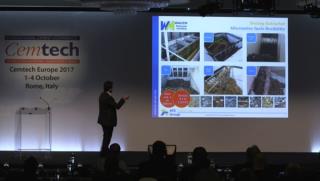
Francisco Leitão, Cimpor (Portugal) - Increasing thermal substitution with alternative fuels by waste pre-drying at the Souselas plant.
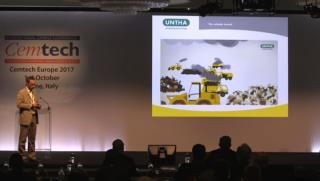
Daniel Wresnik, UNTHA shredding technology GmbH (Germany) - New trends in SRF production using single-step shredding solutions.
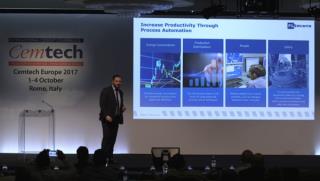
Ebrahim Honar, FLSmidth (Denmark) - Improving productivity through advanced process control system
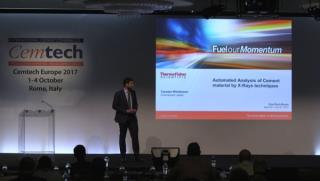
Carsten Wiedmann, Thermo Fisher Scientific (Germany) - New smart automation package for cement analysis.
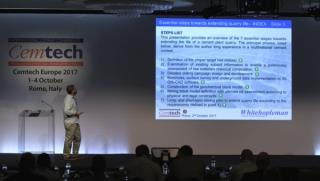
Fabio Coletta, Whitehopleman (Italy) - Essential steps towards extending quarry life
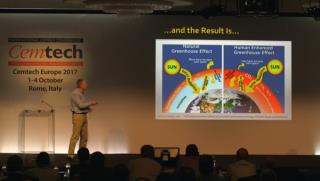
Peter Hoddinott, Independent Consultant (UK) - CO2 reduction down the chain from clinker to concrete construction to energy-efficient buildings.
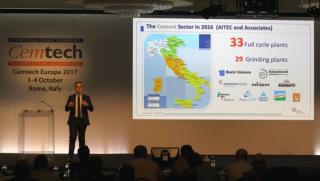
Daniele Gizzi, Environmental Manager, AITEC (Italy) - Sustainability and co-processing in the Italian cement sector
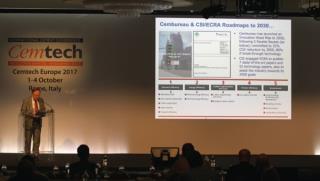
Jim O’Brien, Jim O’Brien CSR Consulting (Ireland) - Can the cement industry achieve its 2030 sustainability ambitions?
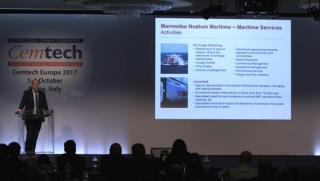
Joel Grau, Marmedsa Chartering (Spain) - Dry bulk freight markets
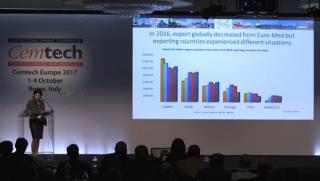
Sylvie Doutres, DSG Consultants (France) - Cement and clinker trade flows to/from Euro-Med countries
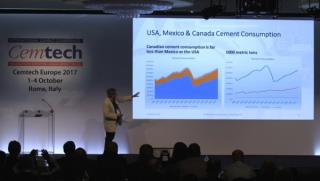
Rob Roy, ROI Economic Consulting (USA) - North American cement sector trends
John Fraser-Andrews, Global Equity Head of Building Materials, HSBC Bank Plc (UK) - World cement industry outlook
Giuseppe Schlitzer, CEO and General Manager, AITEC (Italy) - Italian Cement Sector
Paolo Bossi, CEO, Cementir Italia SpA (Italy) - Italian market overview
Cemtech Asia 2017
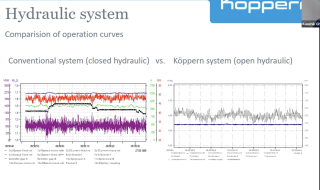
Yannic Sesemann, Köppern - Zero maintenance wear protection for roller presses.
Alan Tran, Aumund Asia (Hong Kong) - Retrofit – the economical alternative to new investment on capital equipment.
Andreas Renetzeder, Scheuch (Austria) - Innovative SCR technologies for NOx, VOC, CO and odour reduction.
Siegfried Andräß, SICK AG (Germany) - Reducing cyclone blockages using hot wet process gas analysis - a case study
Yang Zhi, CBMI Construction Co Ltd / Sinoma Group (China) - EPC + value added services
Mogens Fons, Fons Technology (Turkey) - Innovative clinker cooling technology
Boris Humpola and Mitchell D’Arcy, Wagners (Australia) - Pinkenba expansion project: installation and operation of a new vertical roller mill for cement and geopolymer raw materials production.
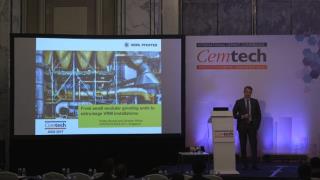
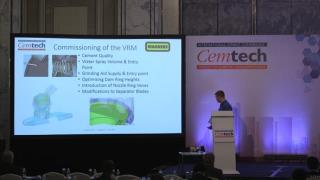
Christian Altherr and Phillip Hempel, Gebr Pfeiffer (Germany) - From small modular grinding units to extra-large VRM installations
Somying Panyacheevita, SCG Group (Thailand) and Luc Rieffel, ATS Group (France) - Successful application of alternative fuels in clinker production.
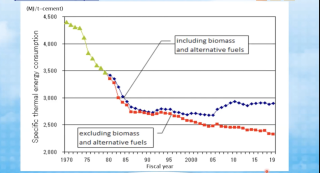
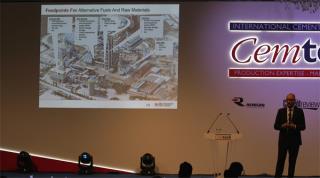
Tetsuo Yokobori, Sumitomo Osaka Cement Co Ltd (Japan) - Experiences of alternative fuels and raw material in Japan
Moises Nuñez, Cemengal (Spain) - Modular grinding system as a means of rapid expansion in Indonesia.
Ricardo Gonzalez, GlobBulk Consulting (Spain) - Low cost grinding plants and import terminal construction
Dr Joe Khor, CPB Engineering Sdn Bhd - The new CMS grinding station in Sarawak
Karsten Horn, INFORM GmbH (Germany)- The rise of the digital workforce in cement logistics
Owen Mulford, Lauritzen Bulkers (Singapore) - Dry bulk shipping and freight market – current and future trends
Marilyn Gardner, MGardner Consultancy (Australia) - Asia Pacific cement trade
Martin Wilkes, Marandale Asia (Indonesia) - The changing cement industry scene in Indonesia
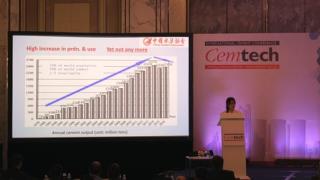
Lan Nguyen, Stoxplus - Vietnam cement sector
Grace Chen, Vice Director, China Cement Association - Overview of the cement industry in China
Emir Adiguzel, CEO, HeidelbergCement Trading (Germany) - Winds of change in the world cement industry
Cemtech MEA 2017
Tony Hadley, Baobab Advisory (France) - Cement in Africa – calm after the storm?
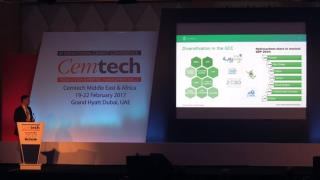
Matthias Herles, IHS Markit (Germany) - GCC Construction Outlook: diversification, mega-projects and financial deficits.
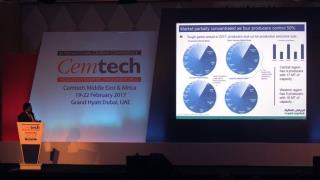
Santhosh Balakrishnan, Riyad Capital - Saudi Arabia’s cement sector, demand drivers and market outlook.
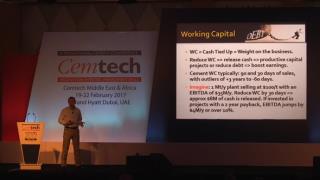
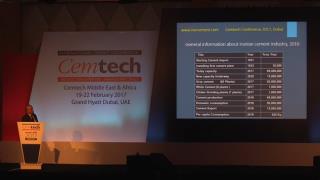
Peter Hoddinott, Independent Consultant (UK) - Optimising your cement business: working capital reduction strategies
Dr Lotfali Bakhshi, Iran Cement - New trends in the Iranian cement industry
Alok Agarwal, Birla Corp Ltd (India) - Industry consolidation in India and market outlook
Jim O’Brien, Jim O’Brien CSR Consulting (Ireland) - Excellence in sustainability, excellence in profitability
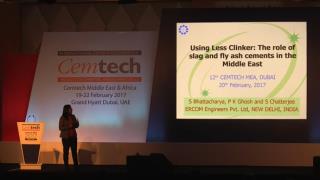
Dr Suchismita Bhattacharya, Ercom Engineers Pvt Ltd (India) - Using less clinker: the role of slag and fly ash cements in the Middle East.
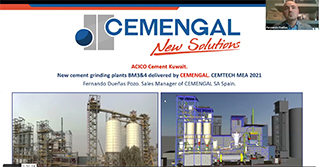
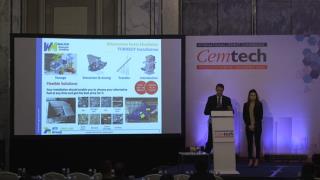
Fernando Dueñas, Cemengal (Spain) - Innovative solutions for a quick penetration strategy into booming cement markets.
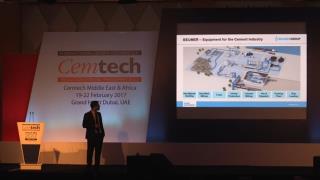
Jawad Baidari, Beumer (Germany) - Alternative fuel handling systems: two case studies.
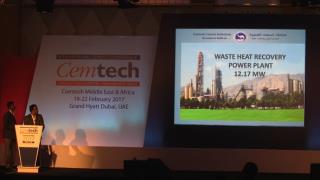
S Raja and V Murthy, Fujairah Cement Industries (UAE) - 12MW waste heat recovery power plant: a performance review.
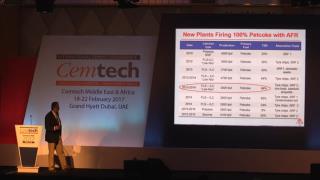
Tahir Abbas, Cinar (UK) - Alternative fuels from preparation to combustion: MENA case studies.
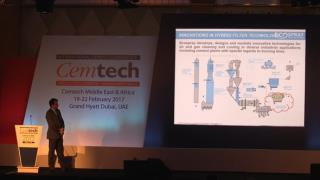
Marco Rovetta, Ecospray Technologies Srl (Italy) - Innovations in hybrid filter technology.
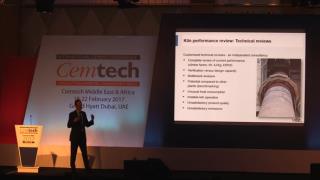
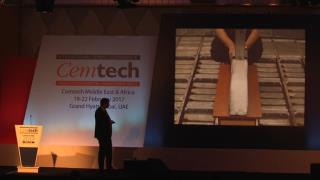
Volker Hoenig, VDZ gGmbH (Germany) - Kiln reviews to improve efficiency, output and production costs.
Mogens Fons, Fons Technology International (Turkey) - Clinker cooler retrofit case studies.
Dr Gary Heath, Castolin Eutectic (Switzerland) - Advanced solutions to control wear and corrosion in the cement plant
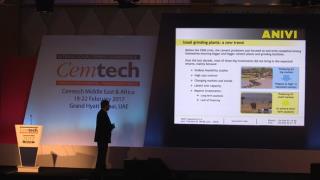
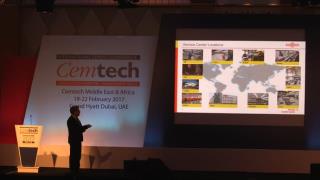
Philippe Lavech du Bos, Anivi (Spain) - How to ensure short paybacks in niche markets.
Patrick Heyd, Gebr Pfeiffer SE (Germany) - Latest experiences with MVR mills
Jaber Malandi, Bedeschi (Italy) - Cement and clinker export terminals: case studies from Turkey, Tunisia and Greece.
Juliano Arantes and Osman Nemli, ABB (Switzerland) - Bursa Çimento improves energy and process efficiency with ABB’s Expert Optimizer.
Mohammad Mehdi Khouzestani, Namadin Sanat Co (Iran) - Control systems: improving ball mill energy efficiency.
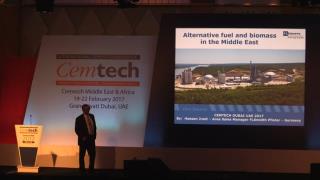
Hassan Jradi, FLSmidth Pfister (Germany) - Alternative fuel and biomass in the Middle East.
Cemtech Europe 2016
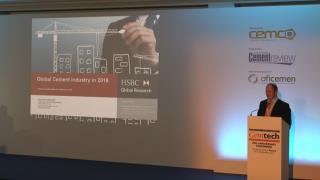
John Fraser-Andrews, Director of Equity Research, HSBC Bank plc (UK) - Overview of the global cement sector in 2016
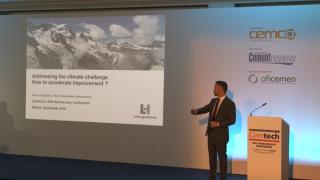
Bernard Mathieu, Head of Sustainability, LafargeHolcim (Switzerland) - Addressing climate change and the role of the cement industry in accelerating improvements
Francesco Brambilla, Director of Sales , HeidelbergCement AG - Mediterranean Basin and Africa: future expectations and existing bottlenecks.
Fabio Chignoli, Bedeschi, (Italy) - Crushing and handling sticky materials: case studies from Russia and Turkey.
Fernando Dueñas, Cemengal, (Spain) - Grinding capacity increase for new and existing plants: real case scenarios
Erkam Kocakerim Limak Cement Group (Turkey) - The Limak perspective in Africa.
Joel Grau, Marmedsa Chartering (Spain) - Dry bulk freight markets.
Javier Martinez, Global Bulk Technologies (Spain) - Cement terminal design and investment strategies.
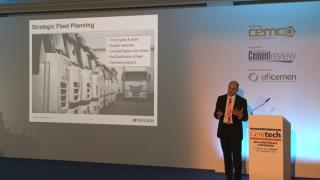
Karsten Horn, INFORM (Germany) - Cement distribution network planning - asset or burden?
Andreas Halbleib, Head Cement Industrial Performance, LafargeHolcim (Switzerland) - Technical Keynote: Transfer of best practices at LafargeHolcim
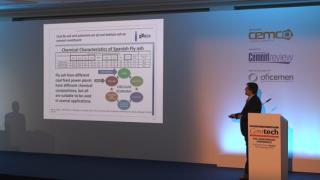
Dr Miguel Angel Sanjuan, IECA/Oficemen (Spain) - Coal fly ash and use of coal bottom ash as cement constituent
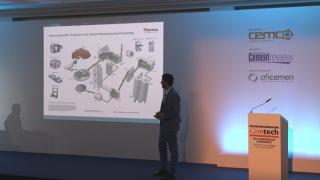
C. Wiedmann, Thermo Fisher Scientific - Real-time X-ray diffraction and applications in the cement industry.
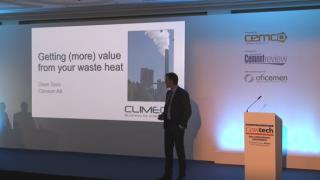
Dean Tosic, Climeon (Sweden) - Getting (more) value from your waste heat
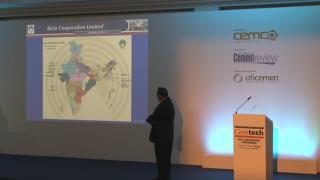
S Thattey, Birla Co Ltd (India) - Case study: sustainable biomass generation and co-processing
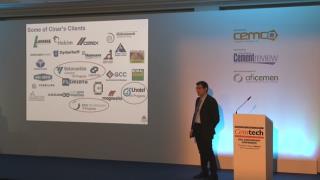
M. Akritopoulos, Cinar (UK), Alternative fuel utilisation technologies
Neville Roberts, N+P (UK) - Co-milling of alternative fuels
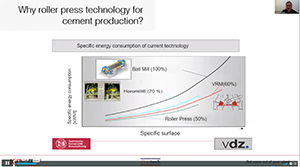
Stefan Seeman, KHD (Germany) - Roller press systems for energy-efficient grinding.
Matthias Dietrich, Sika Services AG (Switzerland) - Improved efficiency of VRMs with grinding aids.
Calciner case study: advanced tools for fuel and production optimisation - Joel Maia, FCT Combustion
Cemtech Asia 2016
Worldwide cement industry trends and forecast to 2018 - David Bowers, ICR Research (UK)
Opportunities for investors in the Vietnam cement industry - Lan Nguyen, StoxPlus Corporation
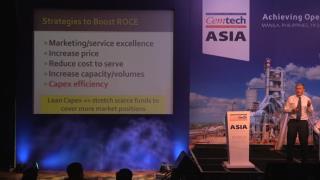
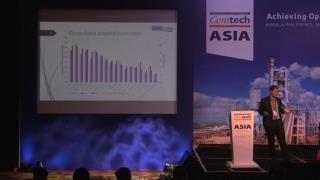
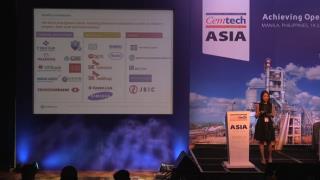
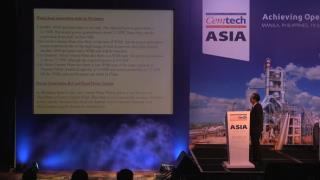
Boosting capital efficiency in the cement industry - Peter Hoddinott, Independent Consultant (UK)
The cement sector in Myanmar: industry survey and project review - Soe Naing, KBZ Industries Ltd (Myanmar)
Alternative raw materials & composite cement strategies - Dr Hans-Wilhelm Meyer, CEMCON AG (Switzerland)
Global leaders in sustainability performance - Jim O’Brien, Jim O’Brien CSR Consulting (Ireland)
Latest innovations to optimise a new grinding plant project - Moises Nuñez, Cemengal (Spain)
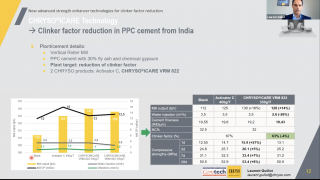
Grinding systems and cement composition optimisation: cement additives added value - Laurent Guillot, CHRYSO (France)
Energy efficient technologies for the cement industry - Andrew Wilson, ABB Switzerland Ltd (Switzerland)
CNA real-time online analysers: benefits in the cement process - Rajendra Mishra, PANalytical BV
Bulk loading operations: different loaders for various vessels - Michele Gatto, Bedeschi Spa (Italy)
Pfeiffer mills with MultiDrive - Phillip Hempel, Gebr. Pfeiffer SE (Germany)
Cement grinding systems and the latest case studies - Dr Joe Khor, CPB Engineering Sdn Bhd (Malaysia)
Developing a cost-effective fuel switching capability - Tahir Abbas, Cinar Ltd (UK)
Successful applications using alternative fuels in the Philippines - Dominador A Reyes & Luc Reibel, Holcim Philippines/Walter Materials Handling (Philippines/France)
Alternative fuel systems at Aalborg Portland Cement, Denmark - Macario Yap, BEUMER Co Ltd (Thailand)
Large clinker coolers in Asia: first operational experiences - Justus von Wedel, IKN GmbH (Germany)
Setting new standards for clinker cooler: Fons Delta Cooler - Ugras Akay, FONS Technology International (Turkey)
Innovative SCR technologies for NOx, VOC, CO and odour reduction - Andreas Renetzeder, Scheuch GmbH (Austria)
Leading Philippines' to a low-carbon operative model - Ernesto Felix, VP Operations & Technology, Cemex
Overview of Korean cement markets: Kim Jae Young, Tallship Trading (Korea)
Truck dispatch automation: optimising logistics with IT - Marc Brida, Fritz & Macziol GmbH (Germany)
Cemtech MEA 2016
Magnesita refractory bricks for the cement industry - Eduardo Matos, Magnesita (Brazil)
Advanced composite and wear solutions for the global cement industry - Kevin Venter, Sila (Australia)
Retrofit of bucket elevator at Yamama Cement - Bilal Jabboul, Beumer Group (Germany)
Iranian White Cement industry - Behrooz Zandi, Managing Director, Shargh White Cement Co (Iran)
Fons Delta Cooler - modern cooler technology - Mogens Fons, Fons Technology International (Turkey)
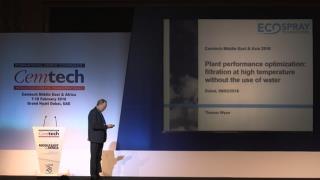
Plant performance optimisation - filtration at high temperature without the use of water - Thomas Wyen, Ecospray Technologies Srl (Italy)
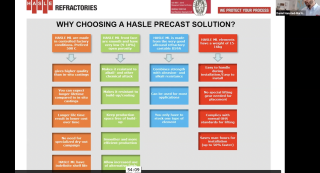
Increasing efficiency in cement production using precast refractory solutions - Harpreet Singh, Hasle Refractories A/S (Denmark)
Emission reduction through kiln optimisation and control techniques - Dr Suchismita Bhattacharya, Ercom Engineers (India)
Supporting economic growth while lowering environmental footprint - Michael Olsen, FLSmidth (Kenya)
Utilisation of AFs from various waste streams in the production process of high quality clinker - Stelios Sycopetrides & Dr Iacovos Skourides, Vassiliko Cement (Cyprus)
Approaches to higher alternative fuel utilisation and the impact on the pyro process - Michael Suppaner, A TEC Production & Services GmbH (Austria)
Grinding plant design, engineering, delivery and installation - Fernando Duenas Pozo, Cemengal (Spain)
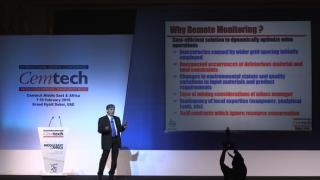
Remote monitoring of limestone quarries to extend resource life - Saumen Karkun, Holtec Consulting (India)
EPC cement project management - critical factors for decision making - Rabi Das Gupta, ETA Star International LLC (UAE)
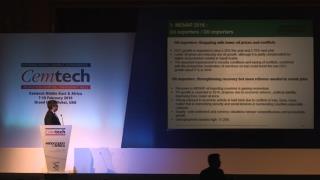
Iranian exports and a new international cement standard - Hamid Reza Tajik, Fars & Khuzestan Cement Holding/ISIRI TC74-ISO (Iran)
Prospects and challenges of the Nigerian cement industry - the BUA experience - Yusuf Binji, BUA Cement (Nigeria)
Modernisation of the Rwandan cement sector - new plant construction and country outlook - Busisiwe Legodi, CIMERWA (Rwanda)
Overview of the East Africa cement market - Francis Mwangi, Standard Investment Bank (Kenya)
The cement markets of Lebanon and Syria - Adib El Hachem, Cimenterie Nationale SAL (Lebanon)
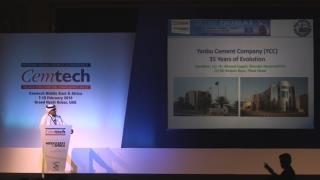
Yanbu Cement Company - 35 years of Evolution - Dr Ahmed Zugail and Kalyan Bose, Yanbu Cement Co (Saudi Arabia)
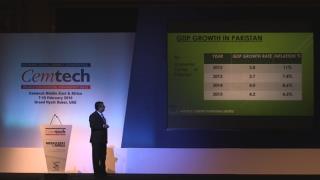
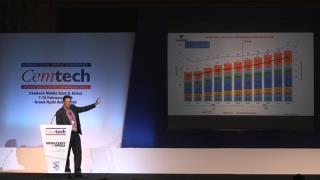
Pakistan cement sector and regional export market challenges: Irfan Amanullah, Attock Cement (Pakistan)
Building a self-sufficient cement industry in Africa - Onne Van der Weijde, CEO, Dangote Cement (Nigeria)
Overview of the global cement sector in 2016 - John Fraser-Andrews, HSBC Bank Plc (UK)
Cemtech Americas 2015
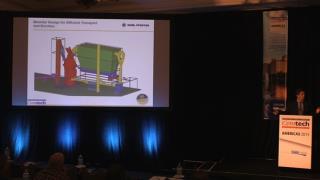
Bulk storage: too big to fail? - Gerard Lynskey, SSI Consulting (USA)
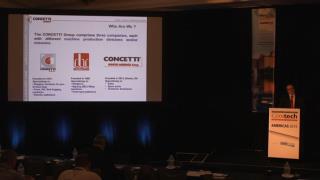
Dry as a bone – packaging dry cement premixes in PE film - Trevor Mitford, Concetti Group (USA)
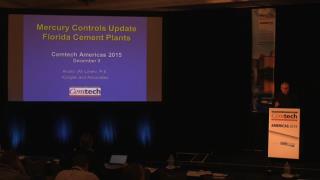
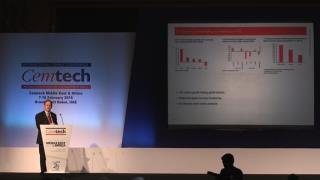
Florida mercury control options - Alvaro Linero, PE, Koogler & Associates (USA)
Utilising dry sorbent injection technology to improve acid gas control for cement plant regulatory compliance - Gerald Hunt, Lhoist North America (USA)
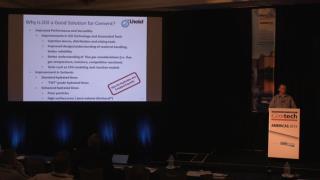
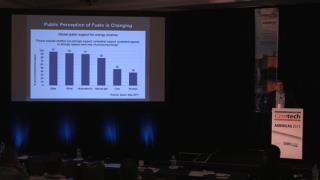
Latest perspectives on the US environmental regulatory front - Carrie Yonley, Schreiber, Yonley & Associates (USA)
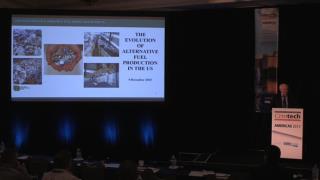
The evolution of alternative fuel production in the United States - Edward Morton, VP, Evolution Environmental (USA)
A strategic approach to alternative fuel utilisation - John Kline, Kline Consulting (USA)
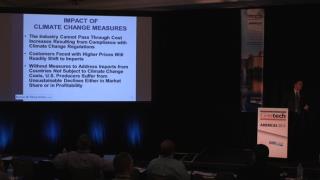
Climate change and regulatory developments in California: what are the implications for the North American cement industry? - Josh Snead, King & Spalding (USA)
Energy performance best practice at Union Bridge - Jeff Hook, Lehigh Cement (USA)
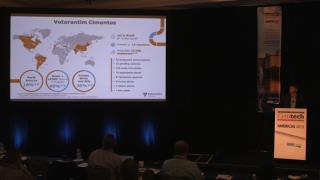
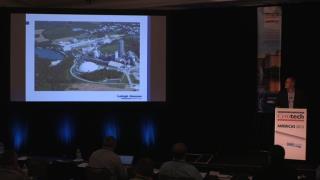
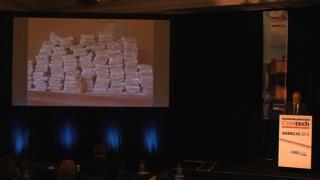
Approaches to CO2 reduction in Brazil - Luiz Germano, Votorantim Cimentos (Brazil)
Global packaging innovations in cement - David Khanna, BPI.Visqueen (UK)
Fons Delta Cooler – breaking new world records. - Cenk Alpaslan, DAL Engineering Group / FONS Technology International (Turkey)
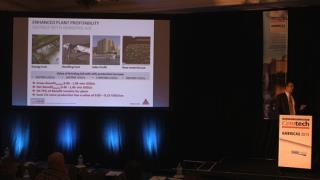
Enhanced plant profitability with chemical additives - Jorg Schrabback, Sika Services AG (Germany)
The benefits of mini-modular mills - Chris Oesch, President, Gebr Pfeiffer, Inc (USA)
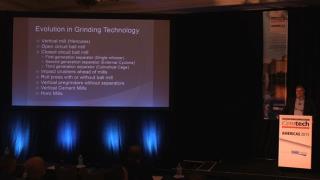
Current and future grinding technologies and techniques - John Kline, Kline Consulting (USA)
Case study – construction of the Piura greenfield integrated cement works - Juan Teevin, Cementos Pacasmayo (Peru)
Latin American cement markets - Francisco Suarez, Scotiabank (Mexico)
Outlook for the US cement industry - Rob Roy, ROI Economic Consulting (USA)
Americas construction outlook: a North/South divide - Scott Hazelton, IHS Economics (USA)
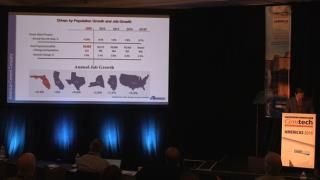
Keynote address: Florida Cement Markets - Cary Cohrs, President, American Cement Company and former PCA Chairman (USA)
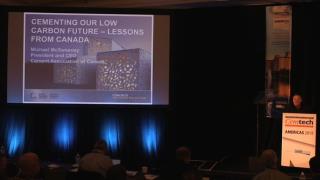
Cementing our role in the low carbon future – lessons from Canada: Michael McSweeney, President and CEO, Cement Association of Canada
Cemtech Europe 2015
CO2 mitigation levers and utilisation in the cement industry: Michel Gimenez, LafargeHolcim CIP (France)
Advanced SCR and SNCR technologies for NOx, CO, VOC: Georg Lechner, Scheuch GmbH (Austria)
High temperature clinker cooler gas filtration without water injection: Thomas Wyen, Ecospray Technologies (Italy)
Solutions for catalytic filtration in the cement industry: Presented by: Pietro Aresta, FLSmidth (Denmark)
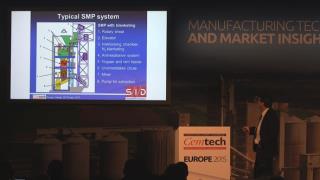
Alternative fuels: SMP system for feeding pasty fuels to cement kilns: Donat Bösch, SID SA (Switzerland)
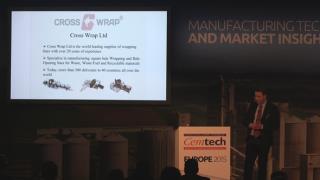
Wrapped bales – solutions for SRF/RDF handling, transportation and storage: Heikki Jyrkinen, Crosswrap (Finland)
Prepol Step Combustor – a simple combustion system for alternative fuels: Sebastian Frie, ThyssenKrupp Industrial Solutions AG (Germany)
Pelletised SRF fuel in Europe: Neville Roberts, N P Recycling (UK)
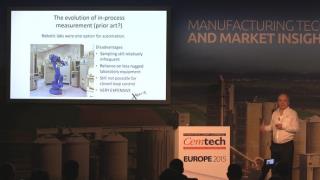
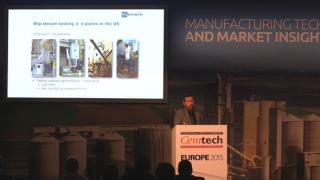
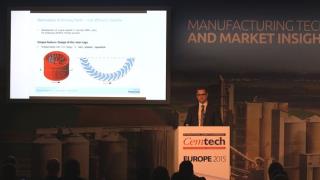
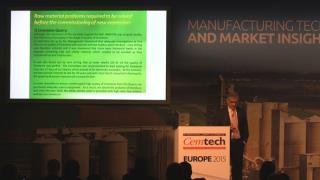
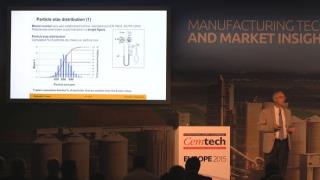
Scalable sampling solutions for in-process particle size monitoring: Stuart Barton, Xoptix (UK)
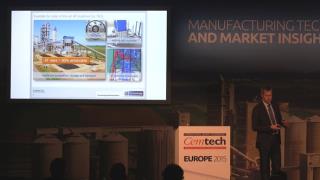
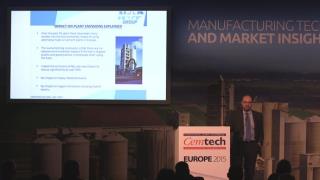
Alternate fuel and raw material utilisation in the Russian cement industry: Jaroslav Stoupa, Eurocement (Russia)
Advanced cement grinding with ‘reduced circuit’: Florian Grassl, PM-Technologies GmbH (Austria)
Expansion of 1000tpd white cement kiln and innovative clinker handling system: Naseer Siddiqui, Saudi White Cement (Saudi Arabia)
State-of-art cement grinding technology: from micro to macro scale: Marco Goisis, Italcementi SpA (Italy)
The wet to dry conversion of Akmenes Cementas: Pietro De Michieli, Bedeschi / CTP (Italy)
The premiumisation of cement: David Khanna, BPI Visqueen (UK)
Alternative fuels handling: Wolfgang Schulte, BEUMER Group (Germany)
Transport logistics – optimising truck productivity and haulier payment schemes: Karsten Horn, INFORM GmbH (Germany)
Financing low carbon cement production in emerging markets: Florence Bachelard-Bakal, EBRD (UK)
A new solution for Mercury - Emission Reduction in the Cement Industry: Michael Suppaner, A TEC (Austria) & Georg Lechner, Scheuch GmbH (Austria).
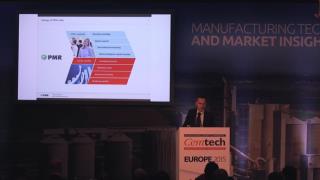
Eastern European and CIS construction and cement markets: Bartlomiej Sosna, PMR (Poland)
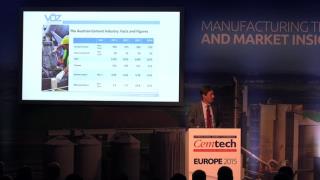
Key developments in the Austrian cement industry: Dr Felix Papsch, Association of the Austrian Cement Industry (Austria)
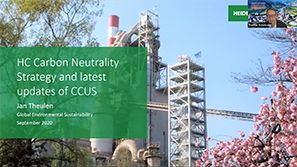
HeidelbergCement’s endeavours in AFR and carbon capture and utilisation: Jan Theulen, Global Director Alternative Resources, HeidelbergCement (Belgium)
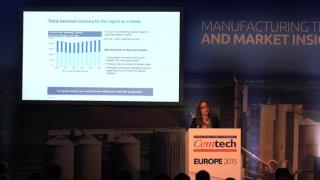
European Union economics and the disconnect between the Northern and Southern construction markets: Dasha Lukiniha, IHS (UK)
Opening address for Cemtech Europe 2015: Sebastian Spaun, Managing Director, Association of the Austrian Cement Industry (Austria).
Cemtech Asia 2015
Alternative fuels: technology, performance and challenges: Dr Arif Bashir, DG Khan (Pakistan)
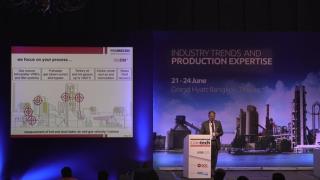
Cost reduction through optimised air and gas flows in cement production: Dirk Schmidt, Promecon, (Germany)
The Mardin Cement 4000tpd clinker cooler retrofit - breaking a new world record with the FONS Delta Cooler: Mogens Fons, Fons Technology International (Turkey)

Palletless packaging systems – Southeast Asian case studies: Soravudh Chotivanich, Beumer Group (Germany)
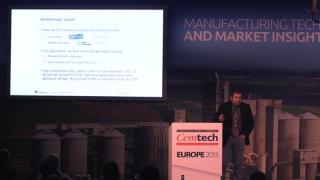
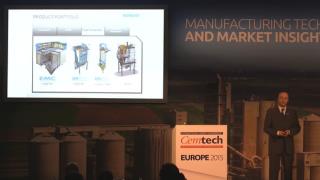
The next generation in advanced technologies for emission reduction, EMC+, SCR and DeCONOx: Andreas Renetzeder, Scheuch GmbH (Austria)
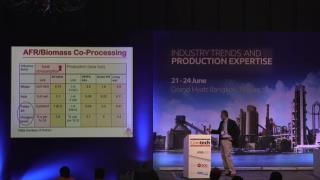
Maximising the thermal substitution rate of alternative fuels in kiln and calciners: Tahir Abbas, Cinar (UK)
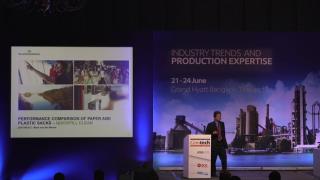
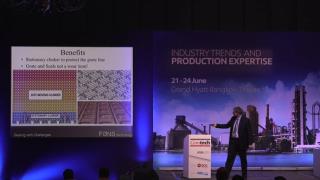
Performance comparison of paper and plastic sacks: Mark Van Der Merwe, Billerud Korsnas (Sweden)
Optimised transport planning: reducing truck fleet costs and gate congestion: Karsten Horn, INFORM GmbH (Germany)
Covering existing stockpiles: Roel Castano, Geometrica (USA)
New high capacity bucket elevator developments: Fernando Libonati, Aumund (Germany)
Controlling particle size distribution for increased grinding efficiency: Stuart Barton, Xoptix (UK)
User experiences of VRM grinding and optimisation at Indocement: Jean-Marc Reginster, HeidelbergCement Technical Centre (Indonesia)
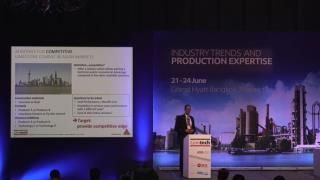
Additives for competitive limestone cement in Asian markets: Jorg Schrabback, Sika Services AG (Germany)
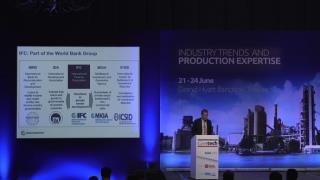
Financing cement in emerging markets, Eric Siew, IFC (Hong Kong)
21MW Waste heat recovery system for Pukrang cement plant: Hakan Uvez, Asia Cement PLC (Thailand)
Challenges in developing a refuse-derived fuel for cement kilns in Southeast Asia from local waste: Brian McGrath, ResourceCo Asia (Singapore)
Successful AF systems for RDF, rice husks and shredded tyres: Luc Rieffel, Walter Materials Handling / ATS Group (France).
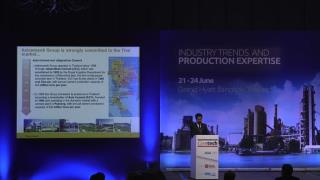
SCG’s Lampang plant: a role model for sustainable development in business operation: Poramen Pradaphon, Siam Cement Lampang (Thailand).
Myanmar emerges – cement market and project developments: Soe Naing, KBZ Industries (Myanmar)
Indian cement industry – present status and the way forward: Dr SK Handoo, Cement Manufacturers’ Association of India (India)
Dry bulk freight rates and trends in clinker & cement trading: Joel Grau Lara, Marmedsa Chartering (Spain)
Indonesia’s cement industry 2015 and beyond: Randolph Wintgens, Wintgens Associates (Indonesia)
Prospects for the Vietnam cement industry: Thuan Nguyen, StoxPlus Corp (Vietnam)
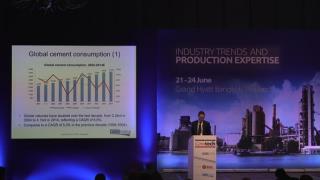
Worldwide cement market trends: Thomas Armstrong, Managing Editor, International Cement Review (UK)
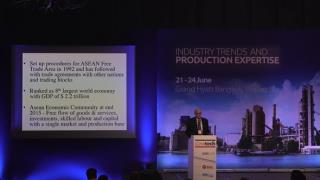
A review of ASEAN cement markets: Martin Wilkes, Independent Consultant (Indonesia)
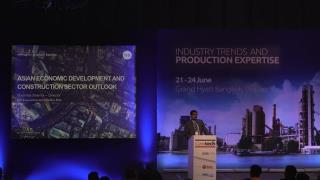
Asian economic development and construction sector outlook: Soumitra Sharma, IHS (Singapore)
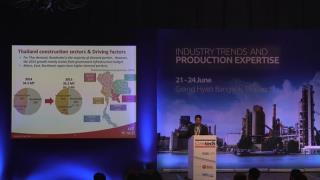
Thailand cement market – growth and sustainability: Nithi Patarachoke, Vice President: SCG Cement – Building Materials (Thailand)
Cemtech MEA 2015
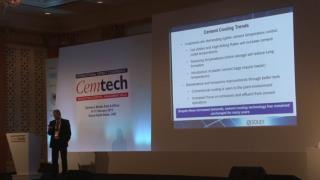
High efficiency cement cooling for cement milling: Nick Sutherland, Solex Thermal Science Inc (Canada)
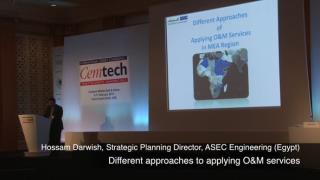
Different approaches to applying O&M services: Hossam Darwish, ASEC Engineering (Egypt)
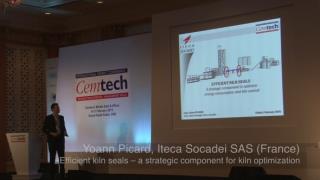
Efficient kiln seals – a strategic component for kiln optimization:Yoann Picard, Iteca Socadei SAS (France)
Greenfield and plant expansion and upgrade projects: Nouran Yaghchi, Whitehopleman (UK)
A new drive concept for large Loesche cement mills: Abdullah Bellafkih, Loesche (Germany)
Continuous loading of dry bulk cargo into ocean-going vessels – the Medcem case study: Jaber Malandi, Bedeschi (Italy)
New bag house filtration for improved emission control – an Egyptian case study: Salvatore Gallo, Boldrocchi (Italy)
Low-cost solutions for increasing production with alternative fuels: Tahir Abbas, Cinar Ltd (UK)
Advanced combustion technology for low grade and course alternative fuels: Sebastian Frie, ThyssenKrupp Industrial Solutions AG (Germany)
Doloma brick – an affordable refractory to line the central burning zone of rotary cement kilns: Eduardo Reis, Magnesita (Brazil)
Part 2: First large-scale biomass preparation and firing at Messebo Cement: Michael Suppaner, A TEC (Austria)
Part 1: First large-scale biomass preparation and firing at Messebo Cement: Getachew Okbay, Messebo Cement Factory PLC (Ethiopia)
Switching to solid fuels in cement plants – technical solutions and case studies: Suchismita Bhattacharya, Penta India Cement & Minerals Pvt. Ltd (India)
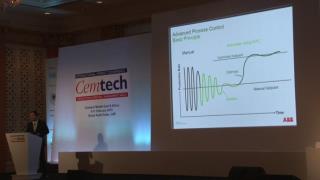
Use of advanced process control for the optimisation of the modern cement plant: Juliano Arantes, ABB (Switzerland)
Innovative techniques adopted by DG Khan for alternative fuels and waste heat recovery: Dr Arif Bashir, DG Khan (Pakistan)
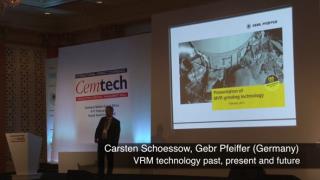
VRM technology past, present and future: Carsten Schoessow, Gebr Pfeiffer (Germany)
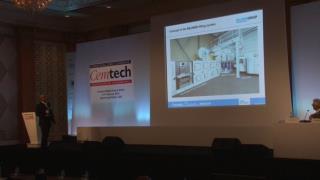
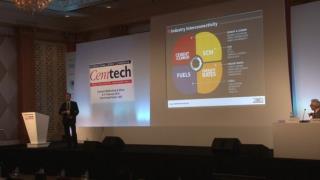
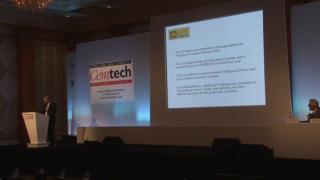
Sourcing, transport and use of fly ash and GGBFS in GCC countries: Jochen Pfitzner, Hawar Power Minerals (Qatar)
Bagging and packaging solutions for worldwide markets - Sharif Wardeh, Beumer Group (Germany)
Focus on the worldwide cementitious materials trade, supply & demand: Gareth Ward, ZAG International (US)
Clinker grinding at Guinea’s largest plant: Philippe Zacca, Guinea Industries Ciments / Bulk Group (Lebanon)
Upgrade & new plant projects across the MENA region: Luc Rudowski, Polysius SAS/ThyssenKrupp (France)
Growth & opportunity in Africa – what does history tell us? Tony Hadley, Baobab Advisory (France)
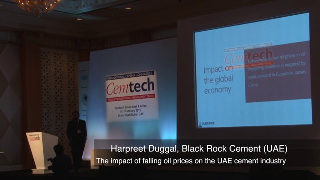
The impact of falling oil prices on the UAE cement industry: Harpreet Duggal, Black Rock Cement (UAE)
GCC cement sector outlook – Hettish Karmani, Global Investment House
Global cement markets – current and future trends: Yuri Serov, Morgan Stanley (UK)
Cemtech Europe 2014
Cemtech MEA 2014
Cemtech Europe 2013
Cemtech Asia 2013
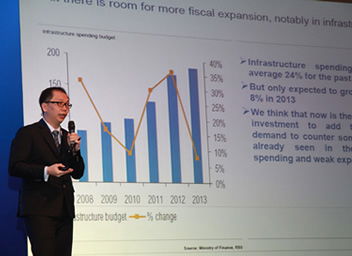
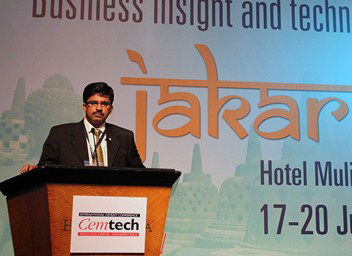
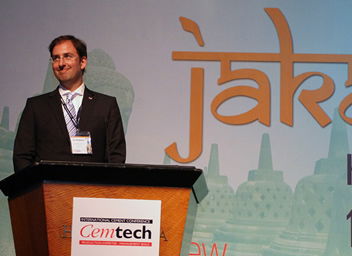
Cemtech Jakarta 2012
Cemtech MEA 2013
Cemtech Geneva 2012
Cemtech MEA 2012
Cemtech Europe 2011
Cemtech Europe 2010


Cemtech Middle East 2010


Cemtech Europe 2009

World carbon markets and their impact on the global cement industry

Confronting climate change and the EU cement industry response

Benchmarking and production optimisation – recent developments

The drybulk freight market – trends and outlook

The Russian cement industry – a return to normality?

Improving operational performance - potential levers to pull
Cemtech Dubai 2009


Cemtech Florida 2008


Cemtech London 2008

European building materials – status and outlook: Elisabetta Zorzi, Fitch Ratings, Italy

New world markets – exploring opportunities in sub-Saharan Africa: Tony Hadley, Dangote Group, Nigeria

The revival of the Russian cement industry: Sean Tangney, Industry Consultant, Ireland

Cement majors: storm warnings posted – how to navigate in rough global conditions: J-C Lefevre-Moulenq, Crédit Mutuel-CIC, France

An unprecedented cement Capex cycle and its outlook: Su Zhang, Exane BNP, UK
Cemtech Singapore 2008


Cemtech Dubai 2008

Cemtech Florida 2007

US cement markets: present trends and industry forecasts to 2012.

Florida cement and construction sectors – what a difference a year makes! Bud Coleman, Roebuck Consulting, USA

The corporate leaders still in consolidation mode – effects on regional/local markets. Tom Armstrong, ICRG, UK

Keeping pace? Greenfield sites and plant expansion in North America 2007-2015. Rob Roy, USA

Mexico: cement markets and expected strategic developments. Gonzalo Fernandez, Banco Santander, Mexico

Reduced emission kiln technologies – can the industry deliver? Frank Zeman, Columbia University, USA
Cemtech Prague 2007


Cemtech Abu Dhabi 2007

Pakistan’s cement industry – prospects & potentials

The Qatar phenomenon – on-going projects drive cement expansion growth

Building and commissioning a 10,000tpd line at Union Cement

The Indian Cement Sector: A new global leader under analysis

GCC Cement Industry: Can Ongoing Capacity Expansions Create Value?

Global Cement - Demand Trends & Strategies of the World Leaders
cemtech florida 2006


Cemtech Rome 2006


Cemtech Barcelona 2005


